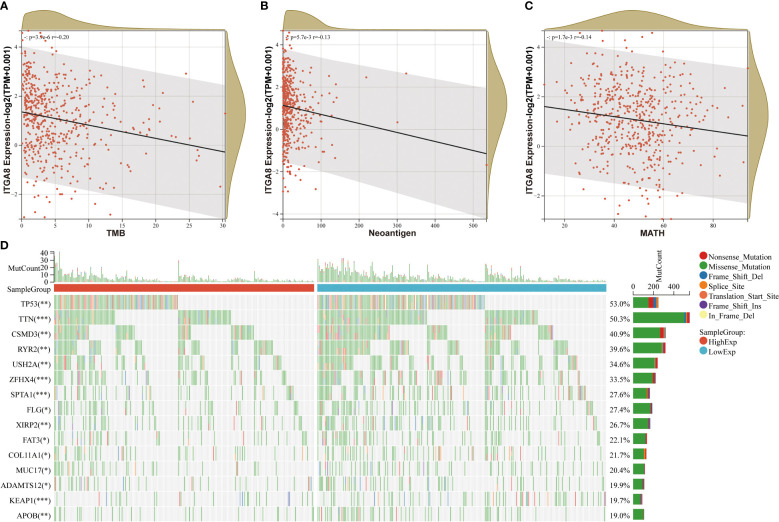
Figure 3.
Correlation analyses between ITGA8 and TMB, neoantigen, and MATH. (A) Correlation analysis between the expression of ITGA8 and TMB in LUAD samples (r = −0.20, p < 0.001). (B) Correlation analysis between the expression of ITGA8 and neoantigen in LUAD samples (r = −0.13, p = 0.0057). (C) Correlation analysis between the expression of ITGA8 and MATH in LUAD samples (r = −0.14, p = 0.0017). (D) Mutation landscape map for the high and low expression groups of ITGA8 in patients with lung adenocarcinoma. *p < 0.05, **p < 0.01, ***p < 0.001. The expression level of ITGA8 gene was marked as Log 2(TPM+0.001) Scale.

