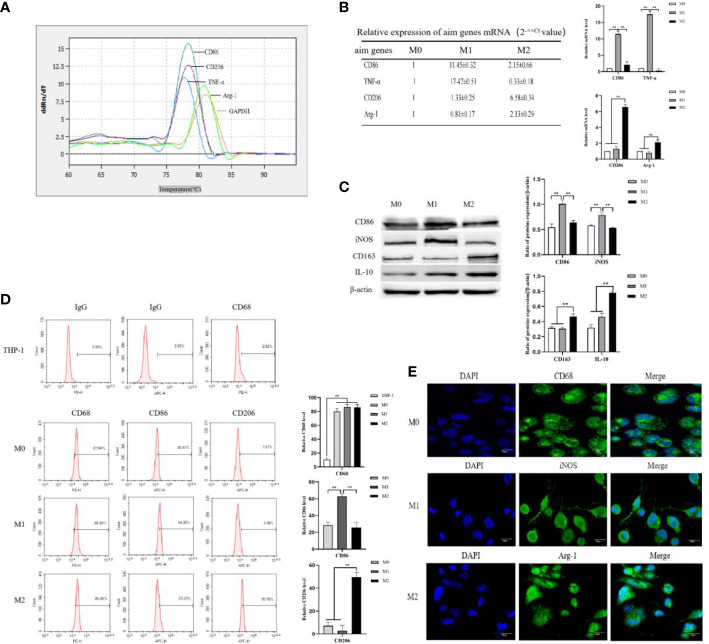
Figure 1.
THP-1 monocytes were induced to polarize toward M0, M1 and M2 macrophages. (A) M0-type macrophages were induced to polarize toward M1- or M2-type macrophages using LPS+IFN-γ and IL-4+IL-13, respectively, for 72 h. Real-time PCR was used to detect the Ct values of the M1-type macrophage markers CD86 and TNF-α and the M2-type macrophage markers CD206 and Arg-1. Melting curve comparison of the relative mRNA expression levels of each target gene in M0, M1 and M2 macrophages. (B) The expression of each target gene in M0 macrophages was used as a control. The relative mRNA expression levels of each target gene in M1 and M2 macrophages were calculated by the 2-△△Ct method. The right column diagrams display the statistical differences in relative mRNA expression levels in each group, **P<0.01. (C) Protein expression of the M1-type macrophage markers CD86 and iNOS, and the M2-type macrophage markers CD163 and IL-10 detected by Western blotting; the right column diagrams display the expression levels of proteins in each group that were statistically analyzed by gray scanning, **P<0.01. (D) Expression of CD68 in the IgG isotype control and THP-1 cells; expression of CD68, CD86 and CD206 in M0, M1 and M2 macrophages detected by flow cytometry; the right column diagrams display statistical analysis of the expression of CD68, CD86 and CD206, **P<0.01. (E) The expression of the macrophage markers M0 (CD68), M1 (iNOS) and M2 (Agr-1) was observed by laser confocal microscopy. The results of the at least three independent experiments are shown.

