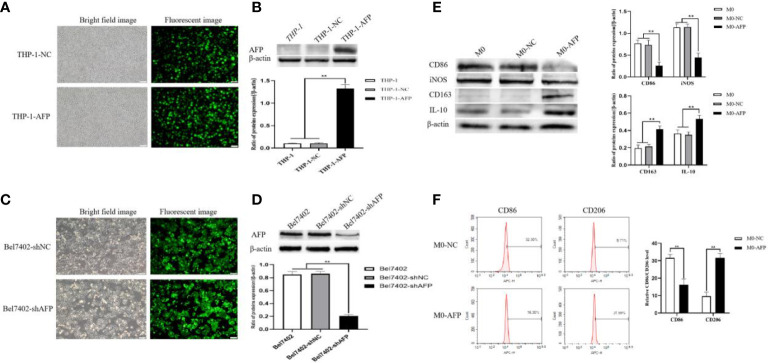
Figure 2.
Establishment of stable overexpression of AFP in the THP-1-cell line and stable interference with AFP expression in the Bel7402 cell line, and AFP influences the expression of macrophage markers. (A) Fluorescence microscope was applied to observe the expression of GFP in THP-1 cells while infected with AFP-expressing negative control lentivirus vectors (M0-NC) or AFP-expressing lentivirus vectors (M0-AFP) after 48 h. (B) The expression of AFP was detected by Western blotting; the low column diagram shows statistical analysis of the expression levels of AFP in each group by gray scanning, **P<0.01. (C) Fluorescence microscope was applied to observe the expression of GFP in Bel7402 cells while infected with interference AFP-expressing vectors after 48 h. (D) The expression of AFP was detected by Western blotting; the low column diagram shows statistical analysis of the expression levels of AFP in each group by gray scanning, **P<0.01. (E) The expression of the M1-type macrophage markers CD86 and iNOS, and the M2-type macrophage markers CD163 and IL-10 was detected by Western blotting; the right column diagram displays the expression levels of macrophage markers in each group, which were statistically analyzed by gray scanning, **P<0.01. (F) Effect of AFP overexpression on the expression of the M1-type macrophage marker CD86, and the M2-type macrophage marker CD206 detected by flow cytometry; the right column diagram shows statistical analysis of the expression levels of CD86 and CD206, **P<0.01. The pictures are representative photos of three independent experiments.

