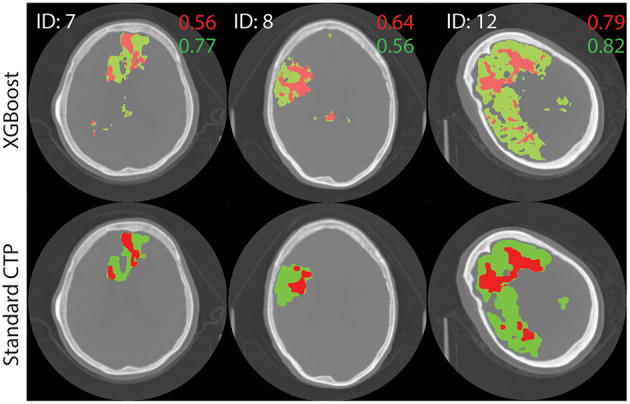
Figure 4.

Test image results. A single axial slice, selected to clearly display the lesion, is shown from each image. The results of processing test images through the XGBoost model to make a prediction on the class label is shown at top. Standard lesion maps are shown at bottom. The predictions for core (red) and penumbra (green) are shown on top of a single axial slice of the brain, obtain with non-contrast CT. Dice similarity score are shown on the image, in corresponding colors.
