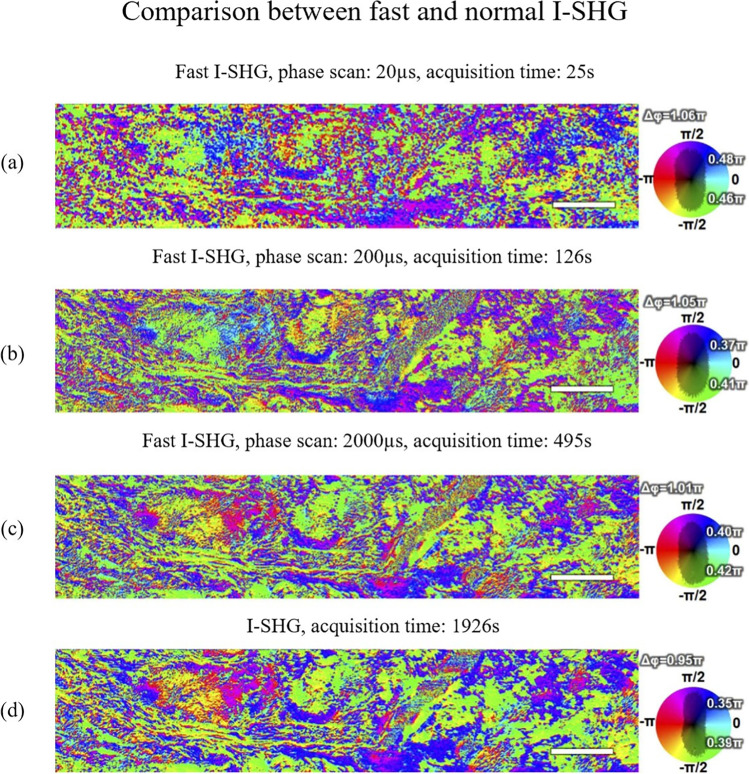
Fig. 16.
SHG phase-map of an adult horse meniscus with fast I-SHG and normal I-SHG. The scale bar is 50 µm. Panels (a), (b), (c) show fast I-SHG with different phase scan durations and panel (d) shows the normal I-SHG at work. (a) 20 μs phase scan is acquired in ~ 0.5 min, (b) 200 μs phase scan is acquired ~ 2 min, (c) 2000 μs phase scan is acquired in ~ 8 min, and (d) using the normal I-SHG method, acquisition takes ~ 32 min. Note that reducing the phase scan duration increases the speed of acquisition, but it also increases the phase errors. Nevertheless, even the longest phase scan duration of fast I-SHG (i.e., 2000 μs) cuts the acquisition time by 25% compared to normal I-SHG which is a huge improvement overall.
Adapted from Pinsard et al. (2019a)

