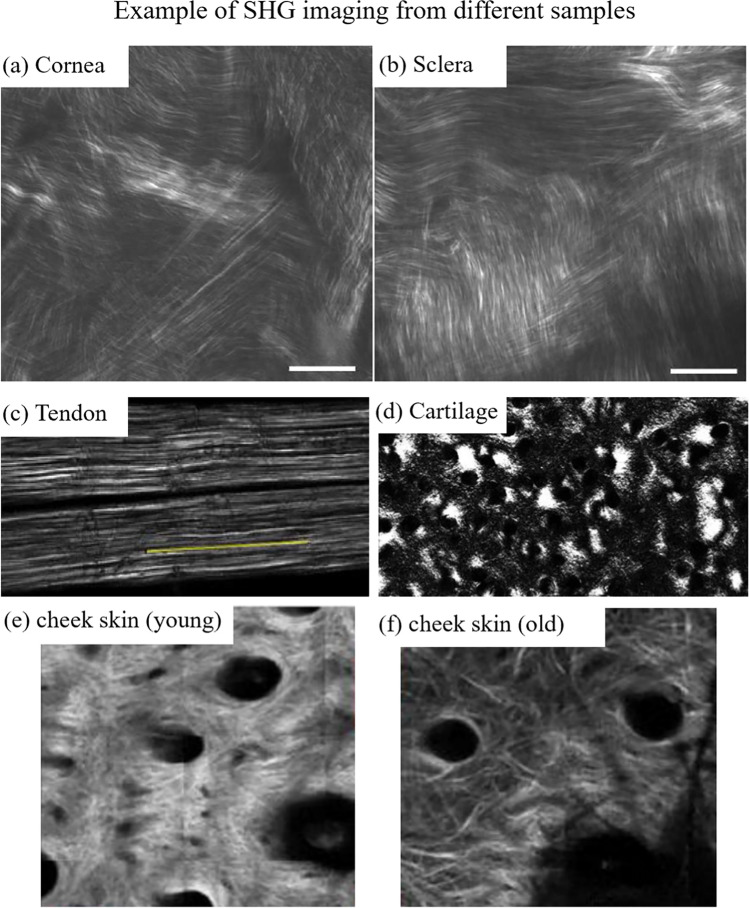
Fig. 5.
Examples of SHG images for various biological samples. SHG images from (a) cornea and (b) sclera, the scale bar is 20 μm. Extracted from Han et al. (2005). (c) Tendon (500 × 150 µm), extracted with permission from Rivard et al. (2014). (d) Cartilage (350 × 200 µm), extracted with permission from Couture et al. (2015). SHG image of skin in young (e) vs. old age (f) (1.6 × 1.6 mm), extracted with permission from Ogura et al. (2019)

