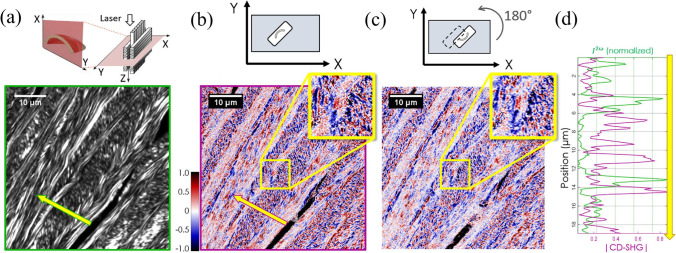
Fig. 9.
Example of CD-SHG applied in the transverse imaging of a human cornea. (a) Schematics and SHG intensity image of the cornea. Panels (b) and (c) show the CD-SHG imaging of the same region of the sample in two different configurations. As it is evident, the CD-SHG sign in both configurations is the same for almost 80% of the imaged pixels. Lastly, in panel (d), the SHG intensity profile (in green) and the CD-SHG absolute value (in magenta) are plotted along the yellow arrow shown in panels (a) and (b).
Modified from Schmeltz et al. (2020)

