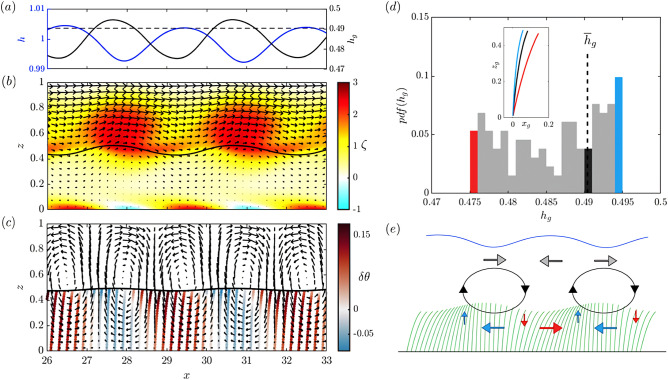
Figure 5.
Instantaneous plots at , for the (a) surface height h (solid blue line) and grass height (solid black line, with dashed line representing the reference steady-state height ), (b) contours of vorticity and arrows representing the velocity field , with the grass height perturbation (black line) amplified by a factor of 4. (c) Perturbation velocity field and grass blade representatives, with colors representing the angle of deflection with respect to the steady-state angle, , in radians. (d) Histogram of the grass height distribution within the entire domain, with inset representing the blade shapes corresponding to minimum (red), maximum (blue), and steady-state (black) height (bin width = 0.001). (e) Schematic of how vortices (iso-vorticity contours) induce grass blade deflection, with arrows representing the velocity perturbation induced, and colors indicating how they deflect the grass blade locally. The blue line on top representing the free-surface.

