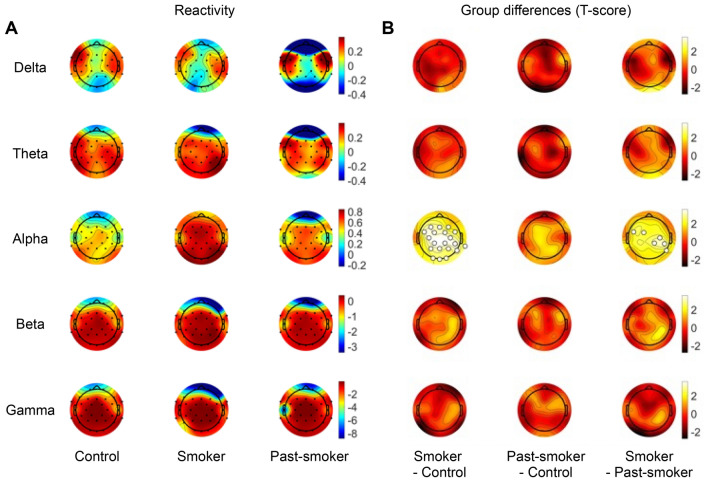
Figure 2.
EEG reactivity between the eyes-closed and the eyes-open conditions. (A) Each row illustrates average EEG reactivity measures calculated in each group, for each frequency band. (B) Statistical group differences in EEG reactivity were observed in alpha band. Particularly, smokers showed larger alpha reactivity compared with past-smokers or non-smoking controls. The channels that showed a significant group difference are marked with larger unfilled markers (PFDR < 0.05).

