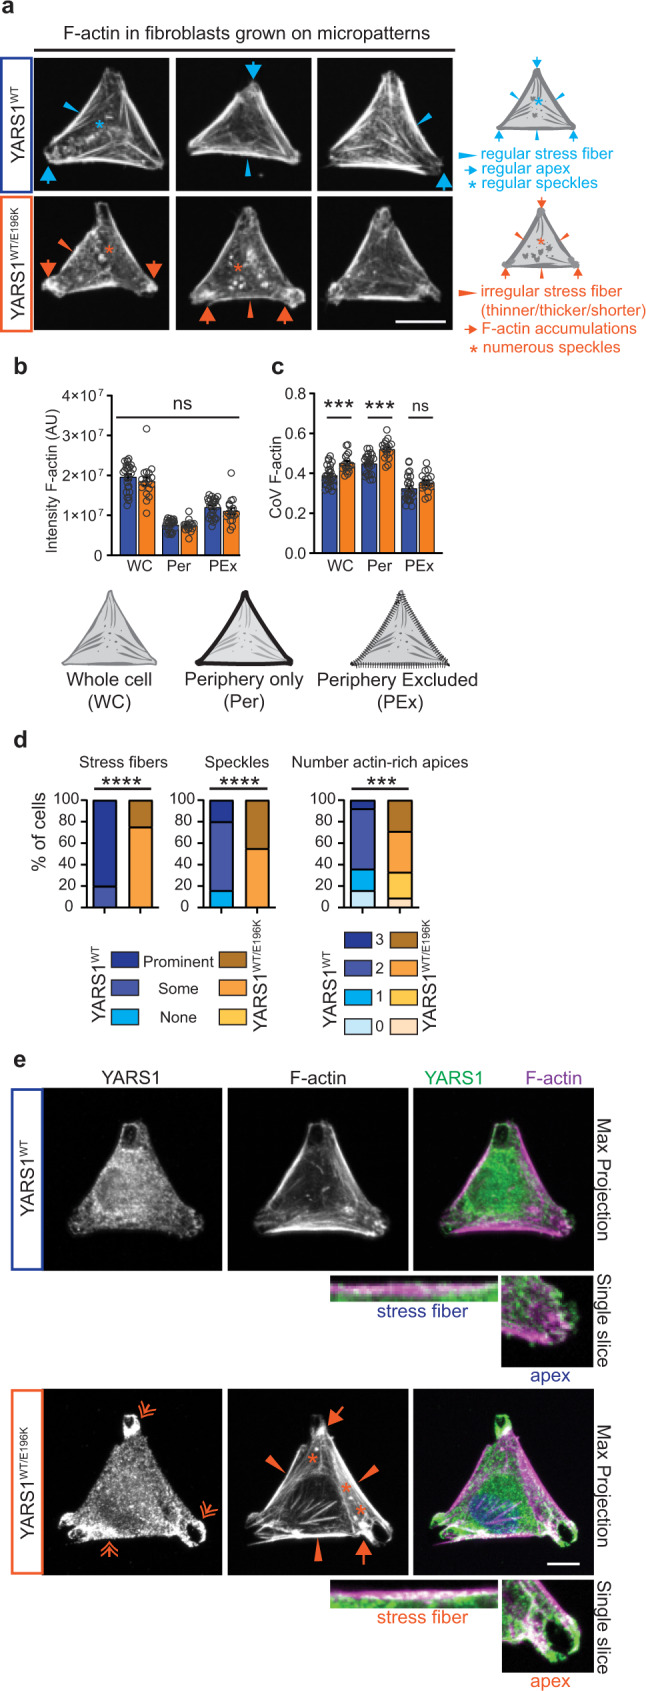
Fig. 3. Actin cytoskeleton organization is perturbed in YARS1CMT fibroblasts.

a Fibroblasts from a control individual (YARS1WT/WT) and a CMT patient (YARS1WT/E196K), plated on fibronectin-coated Y-shaped micropatterns, adopt a triangular shape. F-actin, stained with fluorescently labeled phalloidin, is organized into linear stress fibers at the periphery (blue arrowheads) or crossing the center of cells, and branched structures at the cell apices (blue arrows). Dysregulated stress fibers (orange arrowheads), F-actin accumulations at the cell apices (orange arrows), and speckled accumulations (orange asterisk) are observed in CMT fibroblasts. A schematic of a representative cell with a description of the F-actin structures is shown on the right side of the micrographs. b Quantification of the fluorescence intensity, and c coefficient of variation (CoV) of the F-actin signal in the whole triangle-shaped cell, and in cellular regions limited to the stress fiber-occupied periphery or excluding it. d Frequency of actin-related phenotypes in control and CMT fibroblasts. In b, c, and d, n = 25 (Control) and n = 17 (YARS1E196K) cells from one experiment out of two independently performed experiments. e Maximum intensity projections of confocal images of immunolabeled YARS1 (green) and phalloidin-labeled F-actin (magenta) from control and mutant fibroblasts. Single slice insets of a stress fiber and an apex in the studied fibroblasts. The experiments were repeated two times with similar outcomes. Scale bars – 20 μm. Data in b and c are presented as mean values ± SEM and analyzed by two-sided unpaired t test with ns – non-significant p = 0.3035 in b, p = 0.1080 in c; ***p = 0.0006. After a Chi-square test in d, ***p = 0.005, ****p < 0.0005. Source data are provided as a Source data file.
