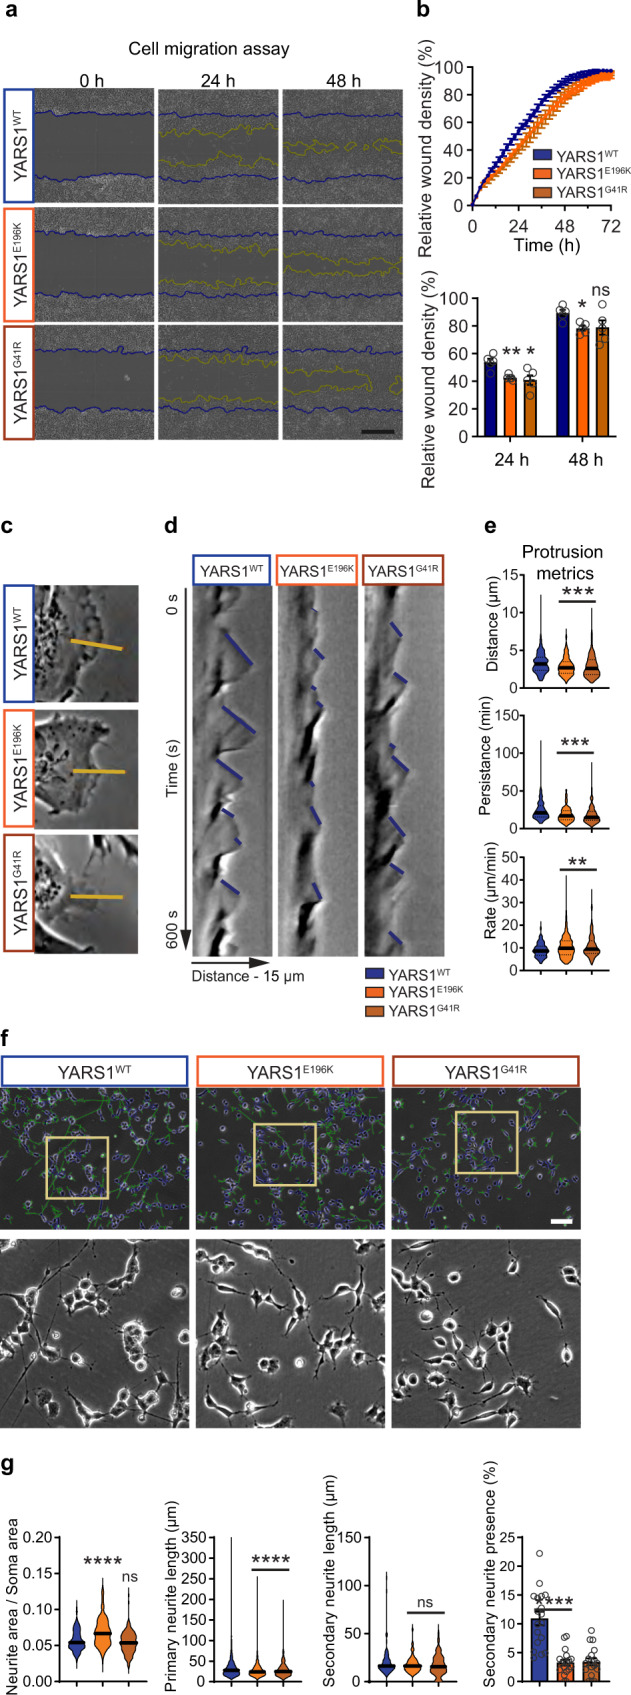
Fig. 4. CMT-causing YARS1 mutations disrupt cell migration, protrusion dynamics, and neurite outgrowth in SH-SY5Y cells.

a Phase-contrast time course imaging of a scratch closure after a mechanical wound induction in a confluent culture of undifferentiated SH-SY5Y cells stably expressing either YARS1WT, YARS1E196K, or YARS1G41R. Yellow lines indicate the migration front at the specific time point while blue lines show the initial position of the wound. Scale bar – 400 µm. b Quantifications of the cell density at the scratch over the time course of 80 h and at specific time points (24 h and 48 h); n = 5 independent measurements, averaged from 10-16 individual scratch wounds, taken every 2 h. Data in the bar graph in b presented as mean values ± SEM; at 24 h – ns – non-significant (p > 0.9999), *p = 0.0317, **p = 0.0079; at 48 h – ns – non-significant (p = 0.2222), *p = 0.0159. c Phase-contrast image sequences (10 fps for 10 min) of individual lamellipodia used to generate kymographs from 15 µm line segments (yellow lines) perpendicular to the lamellipodia movement direction. d Representative kymographs from YARS1WT and YARS1CMT individual lamellipodia, used to determine the protrusion displacement (micrometers on the x axis), protrusion persistence (time in seconds on the y axis), and the protrusion rate (displacement to persistence ratio). e Graph representing the protrusion metrics calculated from the kymographs. Violin plots represent at least 185 individual protrusions per genotype. After a two-sided Mann-Whitney U test for wound distance ***p = 0.0004 and p = 0.0002 for YARS1E196K and YARS1G41R compared to YARS1WT, respectively; for wound persistence ****p < 0.0001; for wound rate – ns – non-significant (p = 0.7920), **p = 0.0077 and p = 0.0028 for YARS1E196K and YARS1G41R compared to YARS1WT, respectively. f Representative phase-contrast images of differentiated SH-SY5Y cells stably expressing YARS1WT, YARS1E196K or YARS1G41R, on which neurite outgrowth and branching were analyzed; blue traces delineate soma, green traces mark projections (primary neurites and their secondary branches). g Quantifications of projections’ metrics in YARS1WT, YARS1E196K and YARS1G41R cells. For neurite/soma area ratio, n = 144 random image fields for each genotype. Primary neurite length determined on n = 2342 (YARS1WT), 1944 (YARS1E196K), and 1723 (YARS1G41R) individual cells from at least three independent differentiations. Secondary neurite length, n = 65 individual cells for each genotype. Percentage of secondary neurite presence (presented as mean values ± SEM), n = 18 random image fields for each genotype. Median and quartiles on the violin plots are indicated by thick and thin black lines, respectively. ns – non-significant, ****p < 0.0001; after a two-sided Mann-Whitney U test. Scale bar – 100 µm. Source data are provided as a Source data file.
