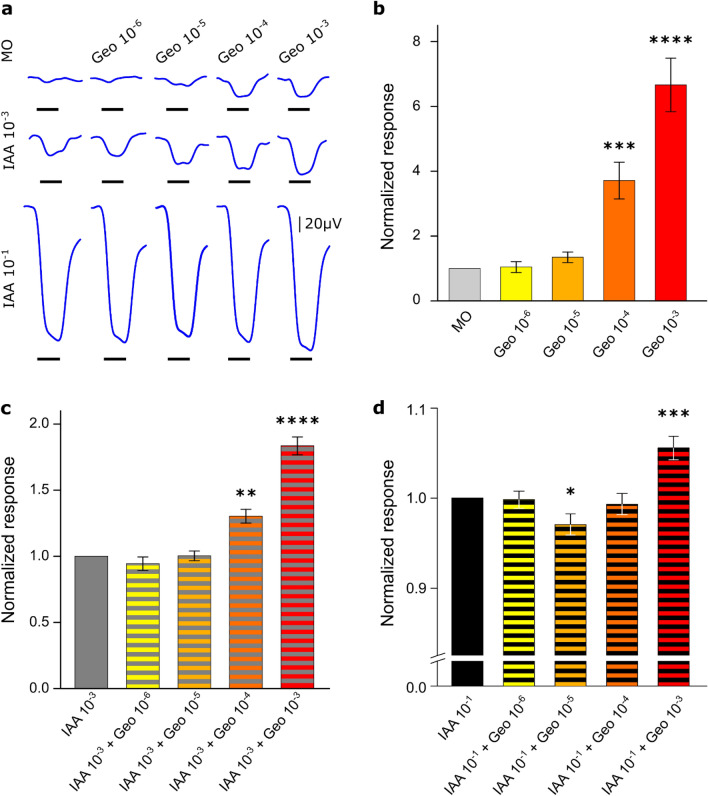
Figure 2.
Olfactory receptor neuron responses. ( a) Example of EAG responses curves from a single bee to all the odours and combinations. The black line below the recording indicates the stimulus presence (2 s). (b) Mean of the normalized response amplitude (± SEM) to different concentrations of geosmin. (c) Mean of the normalized response amplitude (± SEM) to different concentrations of geosmin combined with IAA 10–3. (d) Mean of the normalized response amplitude (± SEM) to different concentrations of geosmin combined with IAA 10–1. IAA 10-x: Isoamyl acetate 10-x (vol/vol); Geo 10-x: Geosmin 10-x (vol/vol); Statistics are from a Friedman test followed by Dunn’s multiple comparisons with Control, IAA3, and IAA1, in B, C, D respectively: ****p < 0.0001; ***p < 0.001; **p < 0.01; *p < 0.05. Individual amplitude responses from all the tested bees (n = 24) are represented in Supplementary Fig. 1.

