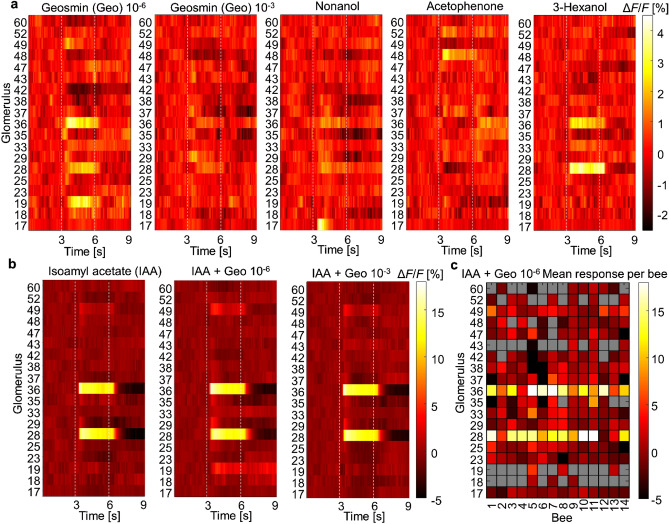
Figure 3.
Glomerular responses. (a) Mean glomerular response curves to pure Geosmin in two different concentrations, 10–6 and 10–3, and to three floral odour compounds; 1-nonanol, acetophenone, and 3-hexanol at concentration 5∙10–3 for 19 glomeruli (Supplementary Fig. 2a) averaged over all identified glomeruli in 14 bees. Odour stimulation started after 3 s and lasted 3 s, marked by dashed white lines. Colour-coded is the calcium-induced fluorescence change in per cent. Differences between the responses to Geosmin 10–6 and 10–3 were significant for glomerulus 19 (t(2) = -12.1, p = 0.013) and glomerulus 36 (t(13) = -2.2, p = 0.047) (b) Mean glomerular response curves to the alarm pheromone compound isoamyl acetate (IAA) at 10–1 concentration and to mixtures of IAA with the 2 concentrations of geosmin. The colour scale is different, given the stronger responses to 10–1 IAA. Differences between responses to pure IAA and to IAA + Geosmin 10–6 are significant for glomerulus 49 (t(13) = -2.6, p = 0.043) and glomerulus 52 (t(6) = -3.3, p = 0.02), between IAA and IAA + Geosmin 10–3 for glomerulus 43 (t(6) = -3.3, p = 0.02), and between IAA + Geosmin 10–6 and IAA + Geosmin 10–3 for glomerulus 52 (t(6) = 3.2, p = 0.028). (c) Time-averaged glomerular response amplitudes to the mixture of IAA and 10–6 geosmin in each bee, showing the stereotypy of the response. Grey represents cases in which glomeruli were not clearly identified.

