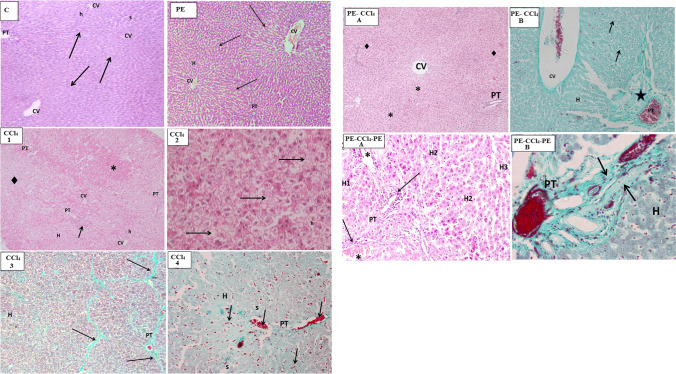
Fig. 5.
Microscopic examination of rat liver tissues from different groups. Where (C) represents the control group (H & E stain, Mic. Mag. × 100). This shape shows that the hepatic lobules (arrows) were arranged in a normal organization, the cords of hepatocytes (h) which radiate from the central veins (CV) are separated by narrow slit-like sinusoids (s), and a normal portal tract (PT) is demonstrated at the upper left corner of a hepatic lobule. (PE) signifies the PE group (H & E stain, Mic. Mag. × 100): normal liver architecture was demonstrated, and the central veins (CV) occupied the center of the hepatic lobule (arrows) with cords of hepatocytes (H) radiating from them, and the portal tract (PT) was located at the angle between the adjacent hepatic lobules. [CCl4 (1) and (2)] represent the CCl4 group stained with H & E. (1) [Mic. Mag. × 100] shows focal areas of eosinophilic hepatocytes (*) alternate with pale areas of vacuolated hepatocytes (♦), a preserved organization of the cords of hepatocytes (H) in many hepatic lobules was noticed, and some portal tracts (PT) show dense cellular infiltration (arrow). In (2) (Mic. Mag. × 400), diffused vacuolation of hepatocytes (h) and groups of degenerated hepatocytes without nuclei (arrow) have appeared. [CCl4 (3) and (4)] signifies the CCl4 group stained with Gomori’s trichrome stain and Mic. Mag. × 100. In (3), thick green bands of fibers were noticed between the liver lobules (arrows), and the vacuolated hepatocytes also appeared. In (4), dilatation of blood sinusoids (s) between hepatocytes (h) and the abnormal inspissation of red blood cells (arrows) in the hepatic sinusoids as in the portal tract tributaries (PT) were presented. The (PE-CCl4) represents the microscopic examination of rat liver tissue of the PE-CCl4 group. In A (H & E stain, and Mic. Mag. × 100), the histological changes persisted as foci of intact eosinophilic hepatocytes (♦) adjacent to pale vacuolated hepatocytes (*). CV, central vein; PT, portal tract. However, in B (Gomori’s Trichrome stain and Mic. Mag. × 400), excessive collagen (star) depositions appeared in the portal tract (PT), and a wide dispersion of degenerated cells (arrow) was noticed among the hepatocytes (H). CV, central vein with inspissated blood. The (PE-CCl4-PE) denotes the PE-CCl4-PE group. In A (H & E stain, and Mic. Mag. × 100), partial recovery varied between apparently normal hepatocytes (H1), vacuolated hepatocytes (H2), and thinned-out hepatic cords formed of degenerated dense cells with dark nuclei (H3). The distorted structure of the portal tract (PT) with persistent excessive stromal cellular infiltrates (arrow) and dilated, blood-engorged portal vein tributaries (*) was illustrated. In B (Gomori’s Trichrome stain, Mic. Mag. × 400), the abundant deposits of collagen fibers were illustrated (arrows pointing to green bands). “H,” hepatocytes

