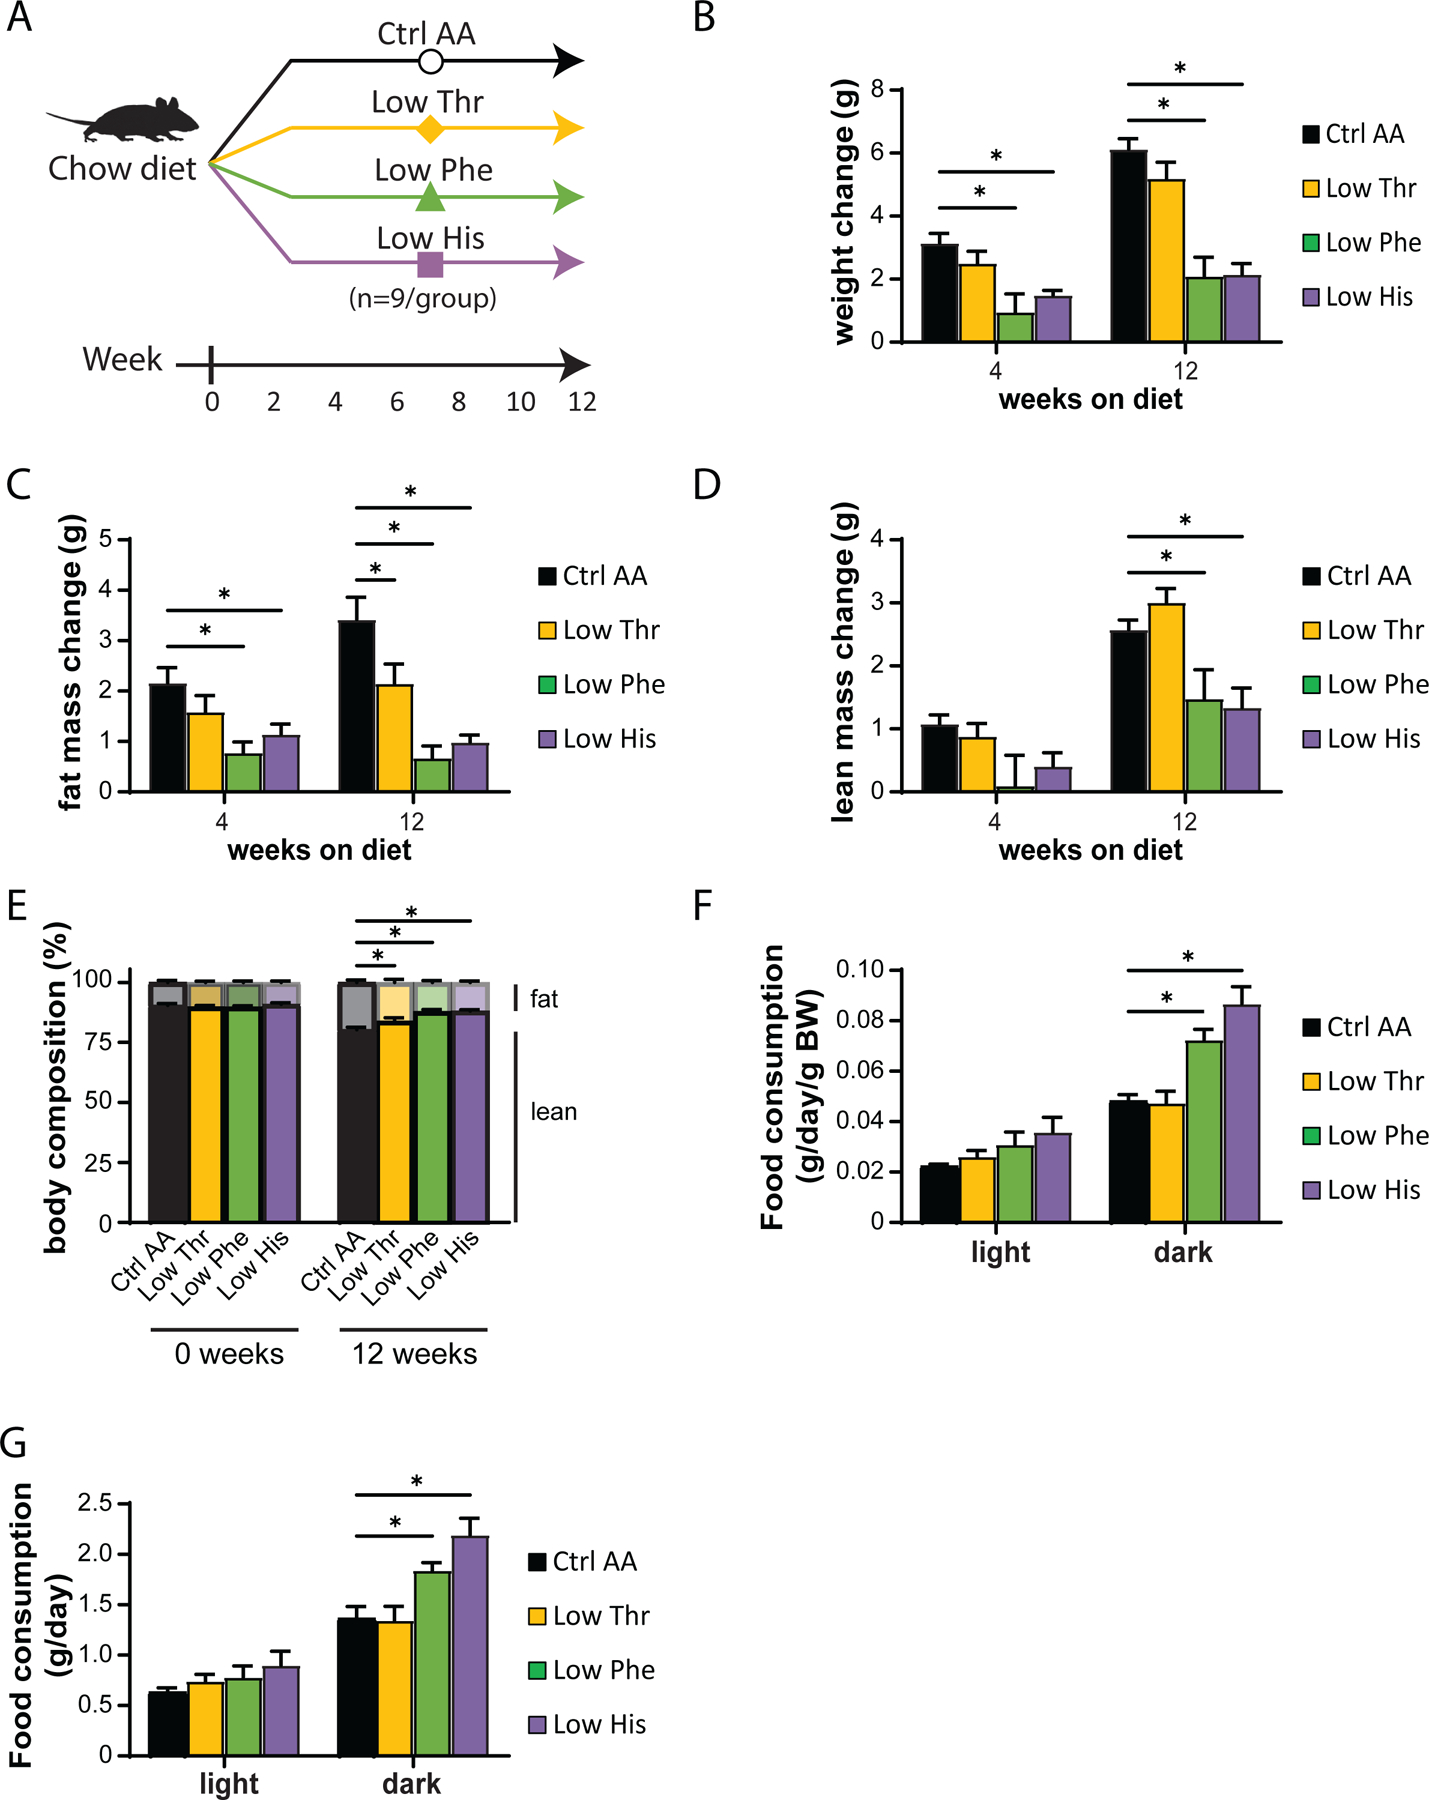
Figure 1. Dietary restriction of histidine, phenylalanine or threonine improves body composition.

(A) Experimental scheme. (B-E) Change in body weight (B), fat mass (C), lean mass (D), and body composition (E) of mice consuming the indicated diets for the indicated time (n=8–9 mice per group, *p<0.05, Dunnett’s test vs. Ctrl AA following a mixed-effects model (Restricted Maximum Likelihood (REML)). (F-G) Food consumption per mouse (F) and normalized to body weight of mice (G) fed the indicated diets (n=8–9 per group, *p<0.05, Dunnet’s test vs. Ctrl AA conducted separately for the light and dark cycles post 2-way RM ANOVA). Data represented as mean ± SEM.
