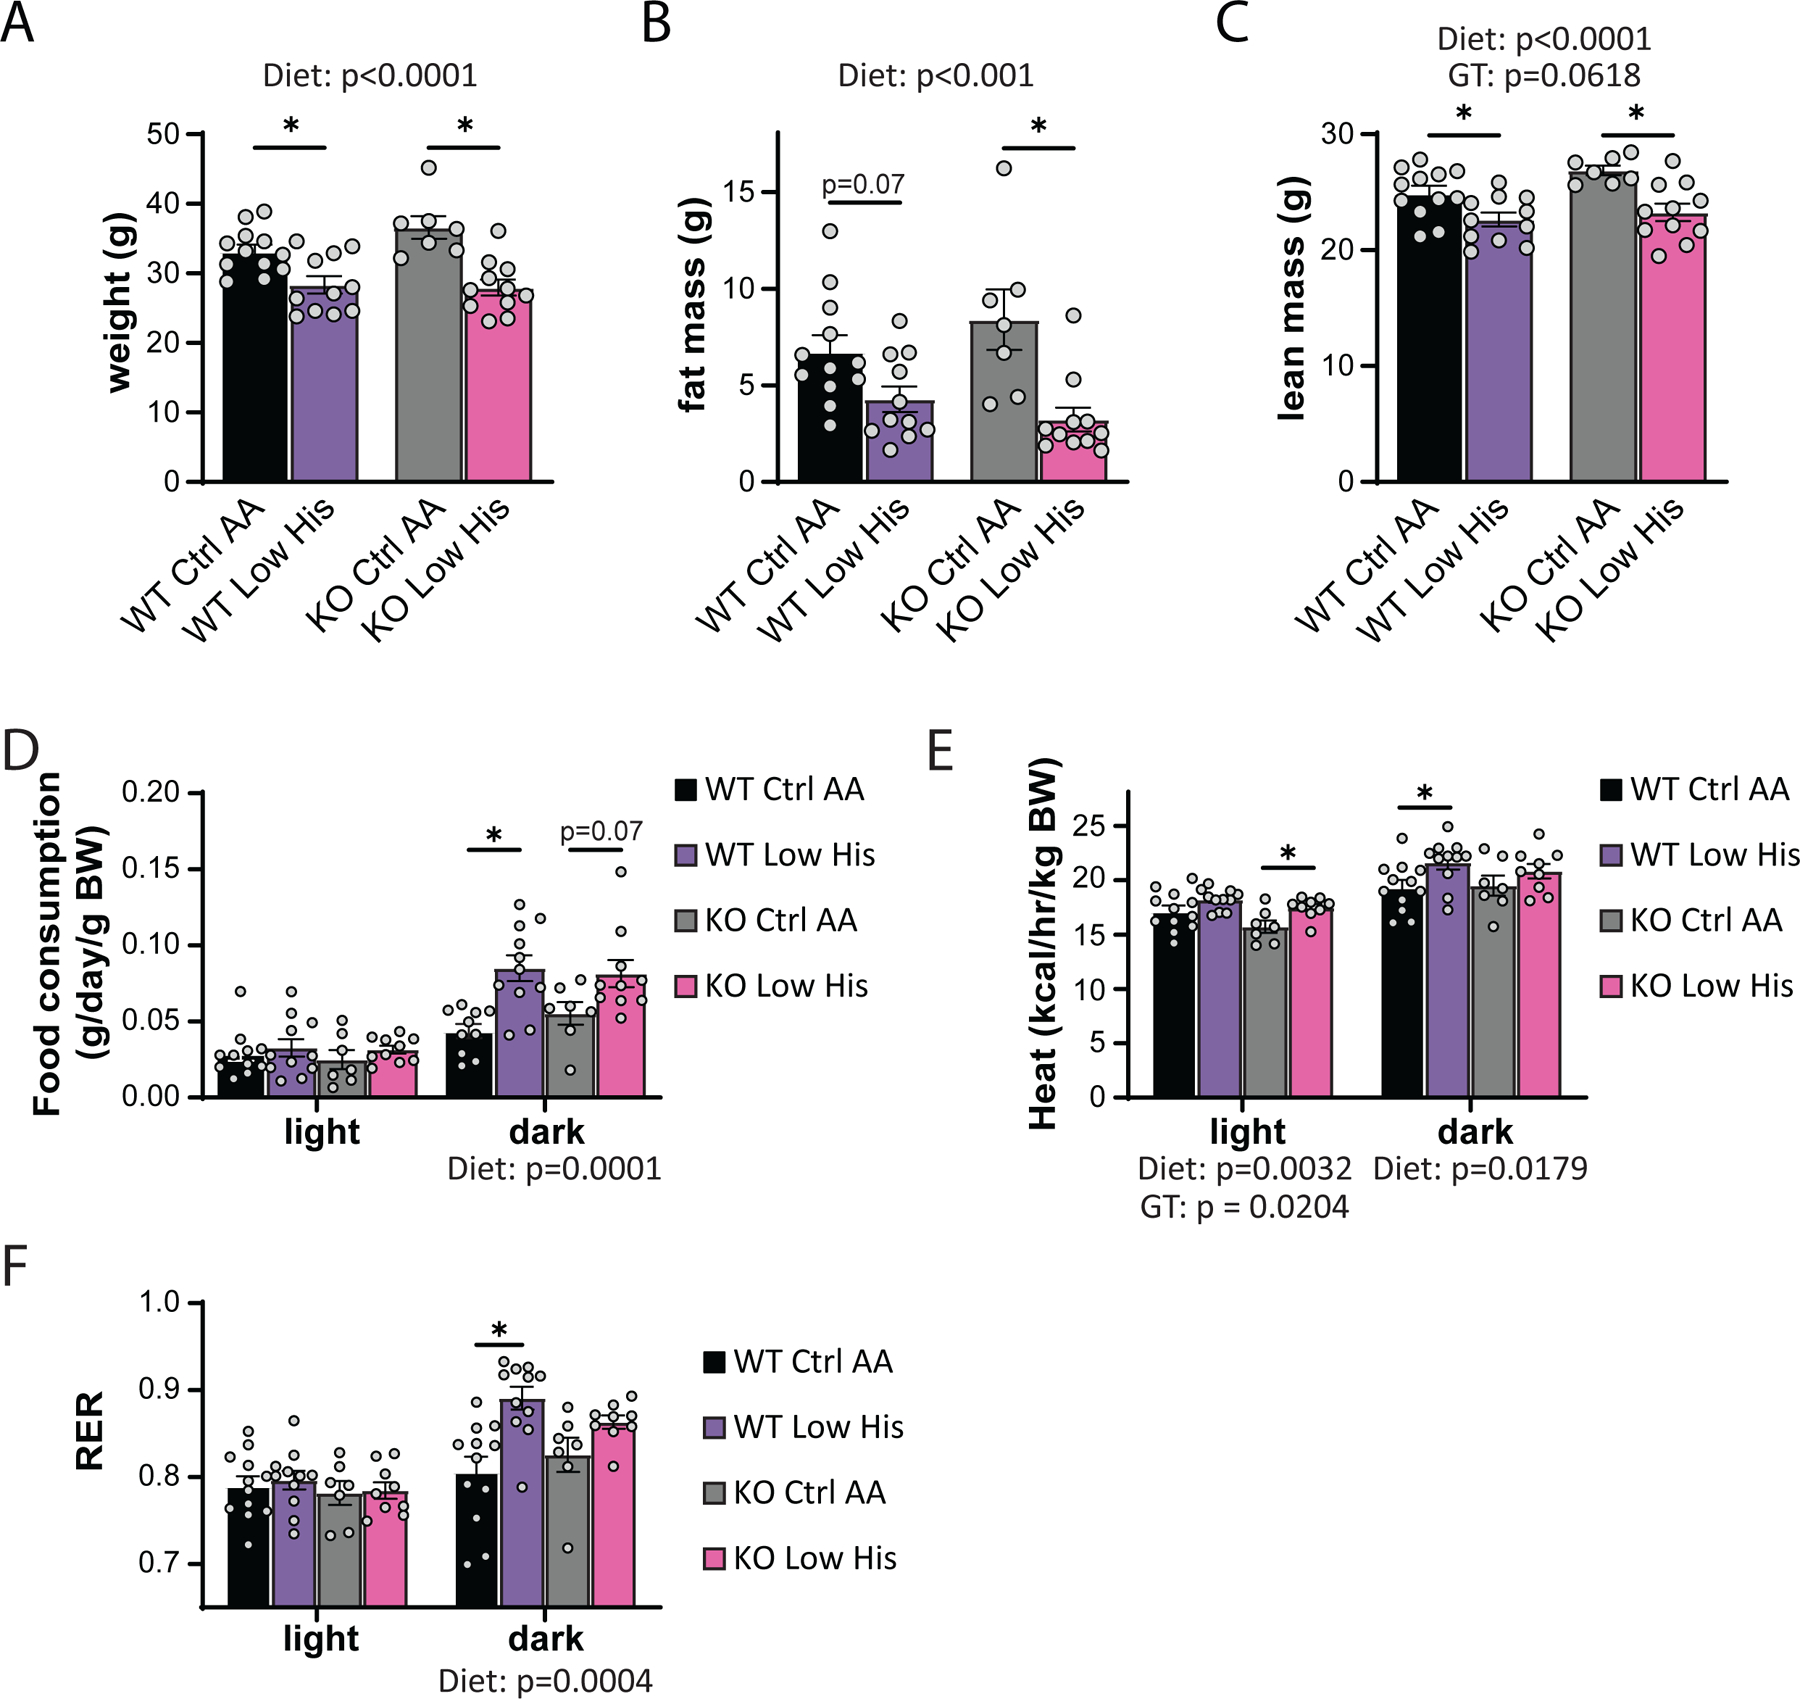
Figure 9. FGF21 is dispensable for the metabolic response to histidine restriction.

(A-C) Weight (A), fat mass (B), and lean mass (C), and fat mass of wild-type WT and Fgf21-/- (KO) mice on the indicated diets (n=7–12 per group, the overall effect of genotype [GT], diet, and the interaction represent the p value from a two-way ANOVA; *p<0.05, Sidak’s test post two-way ANOVA). (D-F) Food consumption normalized to body weight (D), energy expenditure normalized to body weight (E), and RER (F) of mice fed the indicated diets (n=7–11 per group, the overall effect of genotype [GT], diet, and the interaction represent the p value from a two-way ANOVA conducted separately for the light and dark cycles; *p < 0.05, Sidak’s test post two-way ANOVA). Data represented as mean ± SEM.
