
Fig. 2.
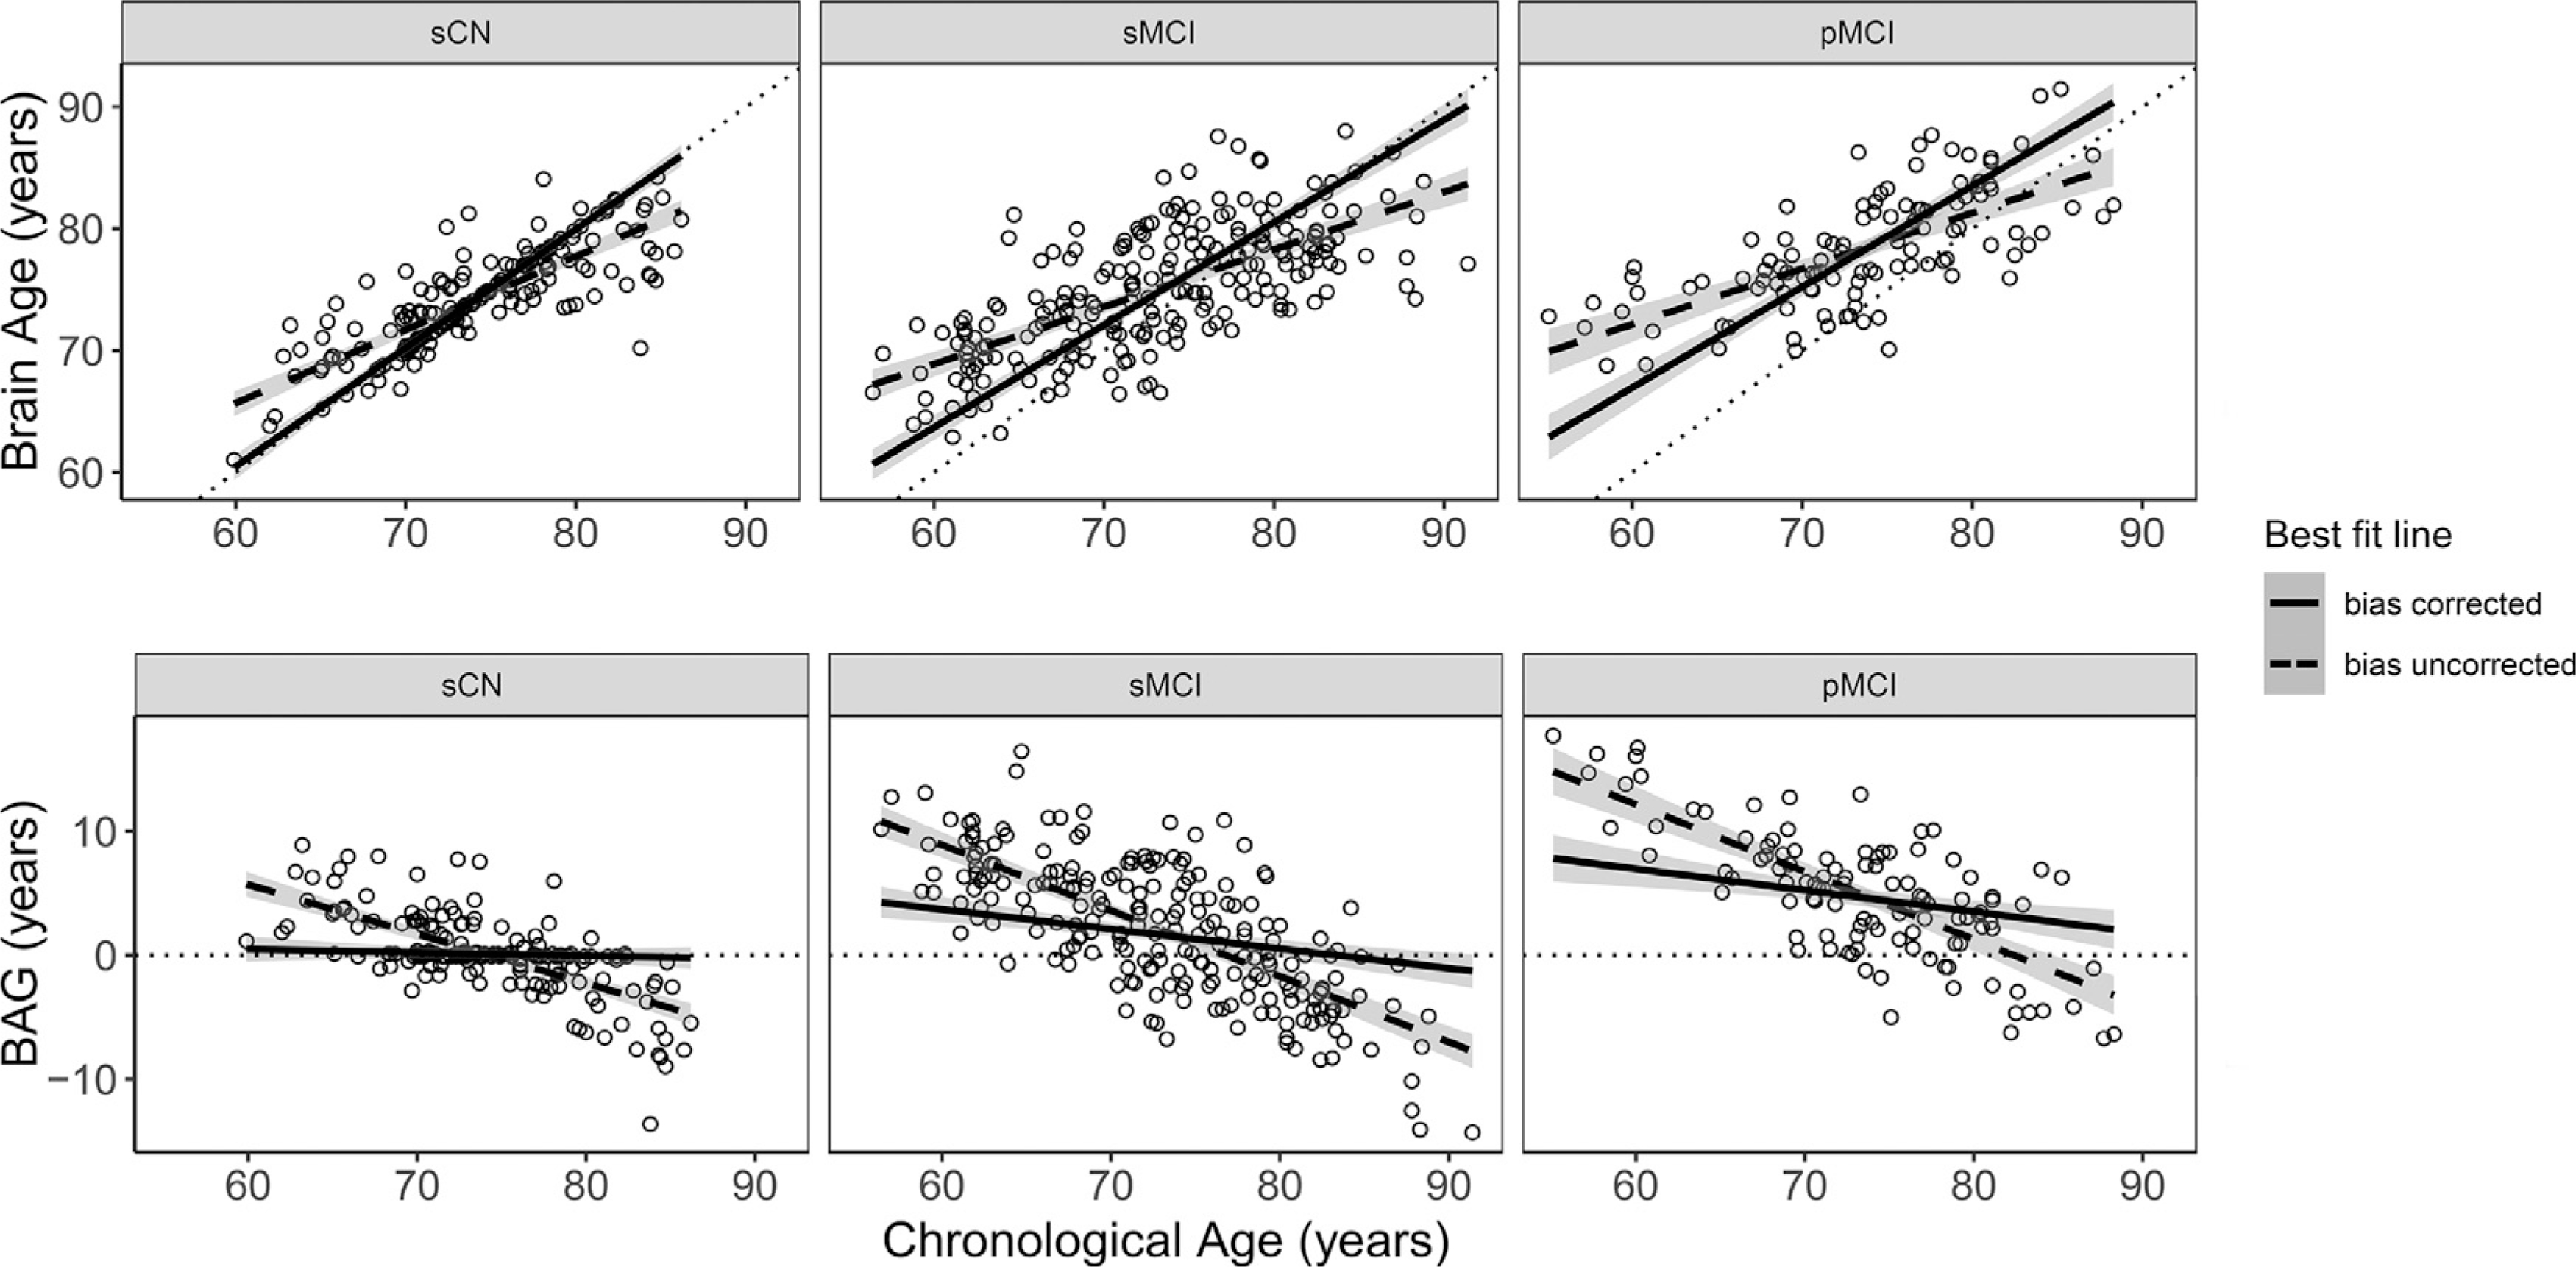
Comparison of best fit line for data before (dashed line) and after (complete line) bias correction is applied for each group. Groups are given as stable cognitively normal (sCN), stable mild cognitive impairment (sMCI), and progressive mild cognitive impairment (pMCI). To show the effect of bias correction, the full sCN sample (N = 227) is plotted here. For all plots, shaded area around each line indicates the 95% confidence interval. Individual points represent baseline data prior to bias correction. Dotted identity y = x and horizontal lines are given as reference. Top: Baseline estimated brain age as a function of chronological age for all individuals in each group. Bottom: Baseline brain age gap (BAG) as a function of chronological age for all individuals in each group.