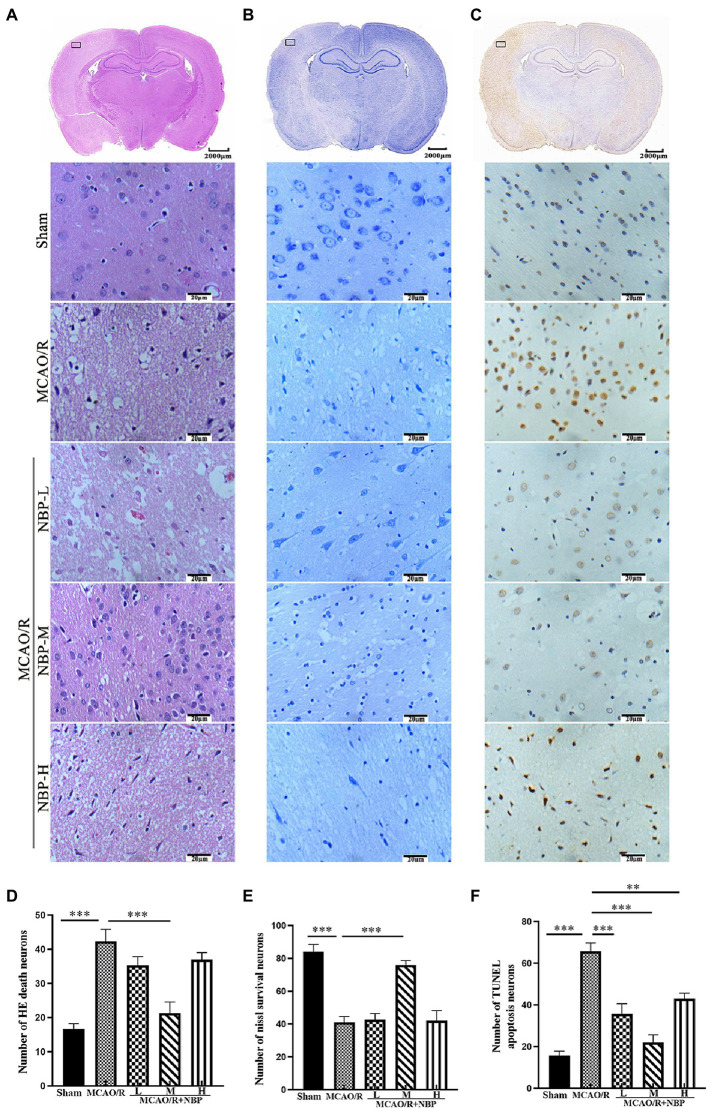
Figure 2.
The histopathological and structural changes by HE, Nissl, and TUNEL staining. (A) HE staining. (B) Nissl staining. (C) TUNEL staining. (D–F) Quantitative analysis of the staining above (×400). HE, hematoxylin and Eosin; TUNEL, terminal deoxynucleotidyl transferase dUTP nick-end labeling. *p < 0.05; **p < 0.01; ***p < 0.001. Data are presented as the mean ± SD, n = 3.

