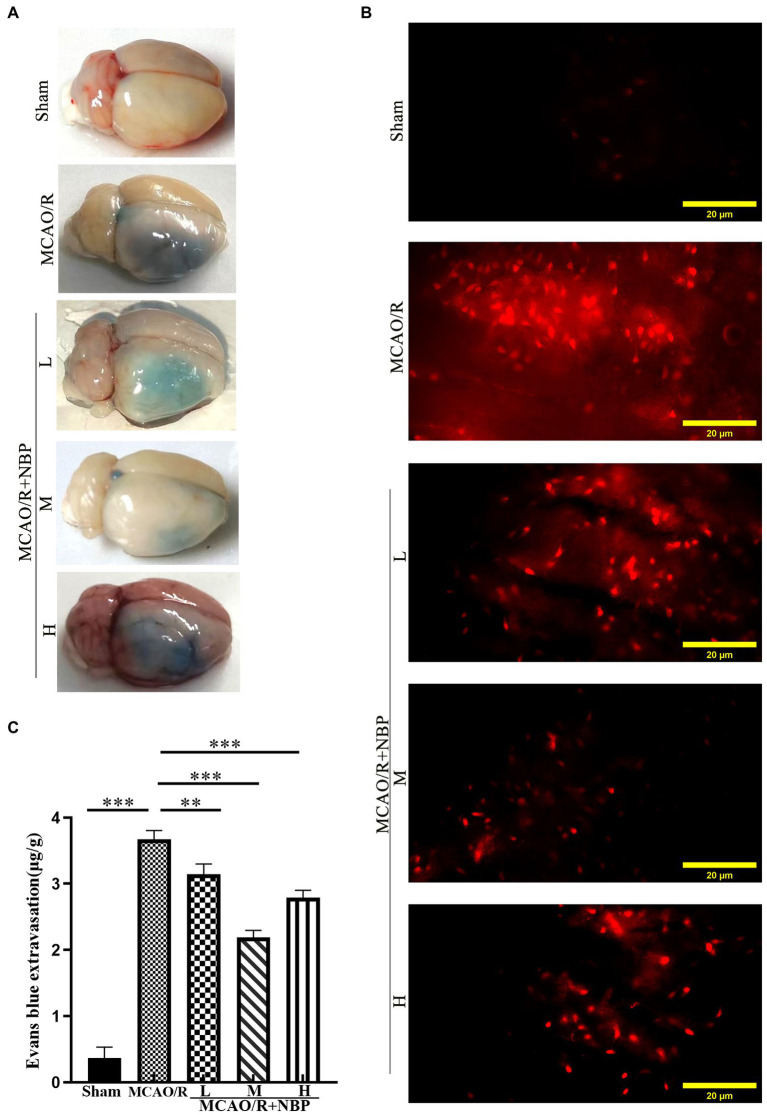
Figure 3.
Evaluation of BBB Permeability. (A) The representative appearance of EB stained rats’ brains. (B) A fluorescence microscope observed the leakage of EB in rats’ frozen slices of brain tissue. (C) Quantitative analysis of EB content in brain tissue. EB, Evans blue; BBB, blood–brain barrier. *p < 0.05; **p < 0.01; ***p < 0.001. The values represent the mean ± SD, n = 4.

