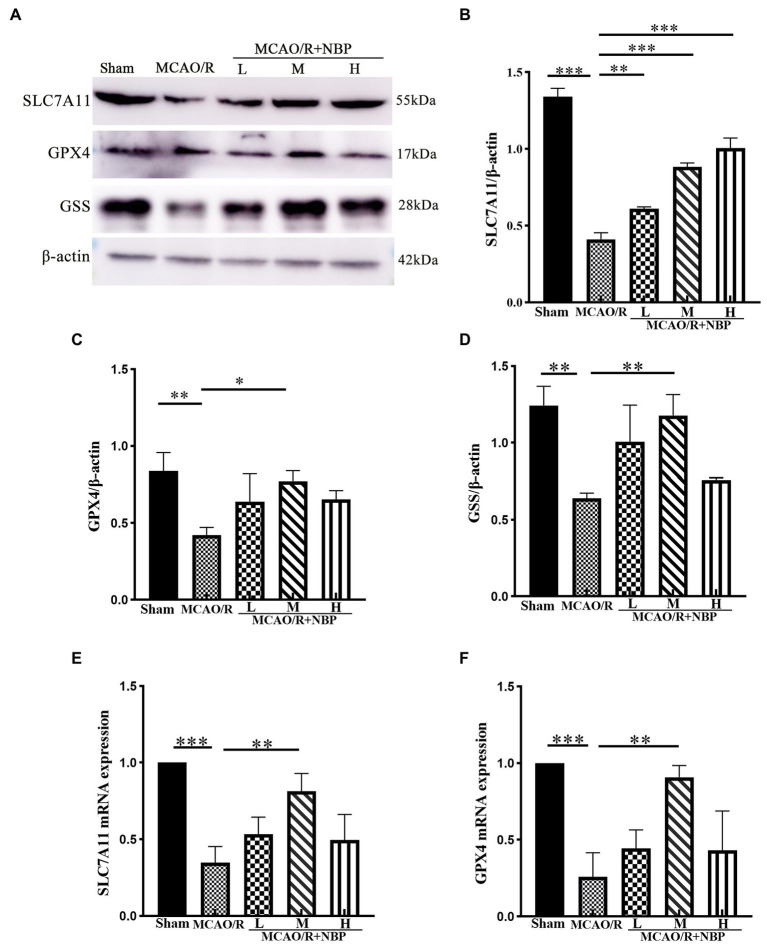
Figure 7.
Western blot and PCR of ferroptosis-dependent SLC7A11/GSH/GPX4 signal pathway. (A) Representative western blot image of SLC7A11, GPX4, and GSS. (B–D) Quantification of SLC7A11, GPX4, and GSS. (E,F) PCR for SLC7A11, GPX4 levels within cerebral cortex tissues. PCR, Real-time polymerase chain reaction. *p < 0.05, **p < 0.01, ***p < 0.001. The values represent the mean ± SD, n = 3.

