
Figure 4.
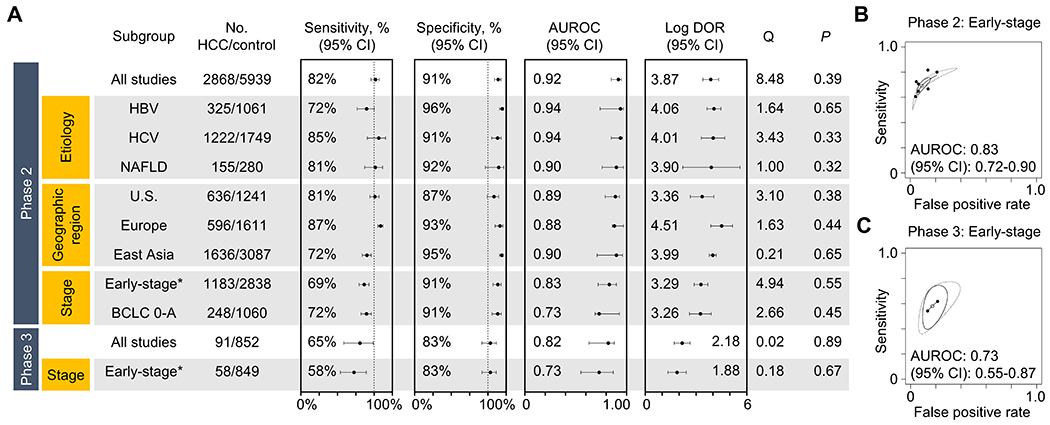
Performance of the GALAD score according to clinical subgroups and the phase of cancer screening biomarker study (meta-analysis). (A) Sensitivity, specificity, AUROC, and log diagnostic odds ratio (DOR) by clinical subgroups defined by HCC etiology, geographic region, and HCC stage. (B) Summary ROC curves for early-stage HCC in phase 2 (upper panel) and 3 (lower panel) studies are separately presented. DerSimonian and Laird random-effect method was used for the meta-analysis, and heterogeneity was assessed by Cochrane’s Q statistic. See Table 2 and Supplementary table 3 for details of the individual studies used for the meta-analysis.