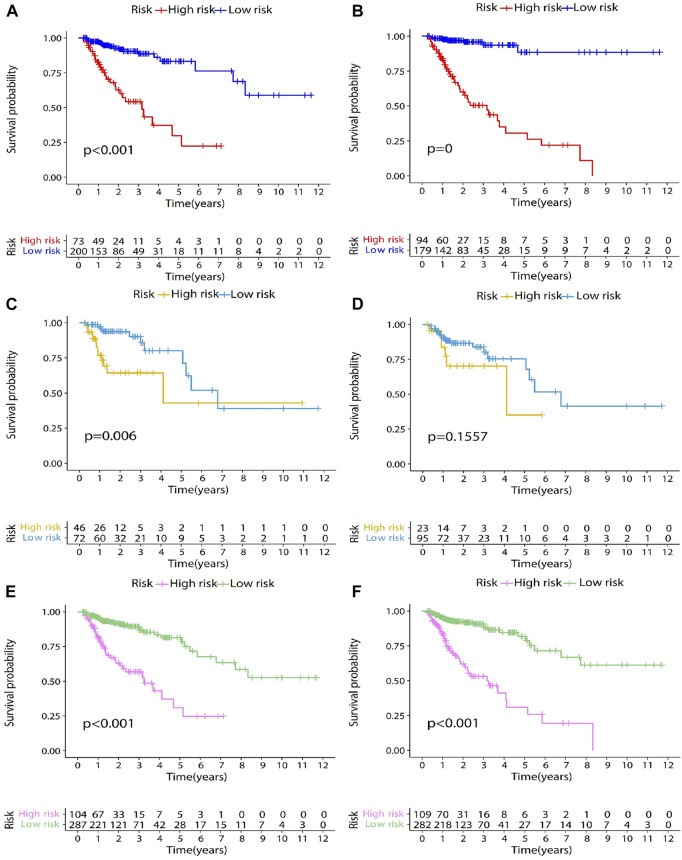
FIGURE 3.
Survival analysis results of training dataset, testing dataset, and entire TCGA dataset. The genes were screened by LASSO regression, and the model was constructed by multifactor cox regression. The survival analysis results of the training dataset, the testing dataset, and the entire TCGA dataset are shown in Figures 3 (A,C,E). After screening the genes through univariate Cox analysis, the survival analysis results of the training dataset, testing dataset and the entire TCGA dataset are shown in Figures 3 (B,D,F). In the survival analysis chart, the x-coordinate represents the survival time, in years. The y-coordinate represents the survival probability. The patients were divided into two groups according to the optimal cut-off value. They are low-risk group and high-risk group. p-value represents the difference in survival between the two groups. At the bottom of the figure is a table. The abscissa is the survival time in years. The ordinate is the high-risk group and low-risk group, and the value represents the number of patients remaining at each time point.

