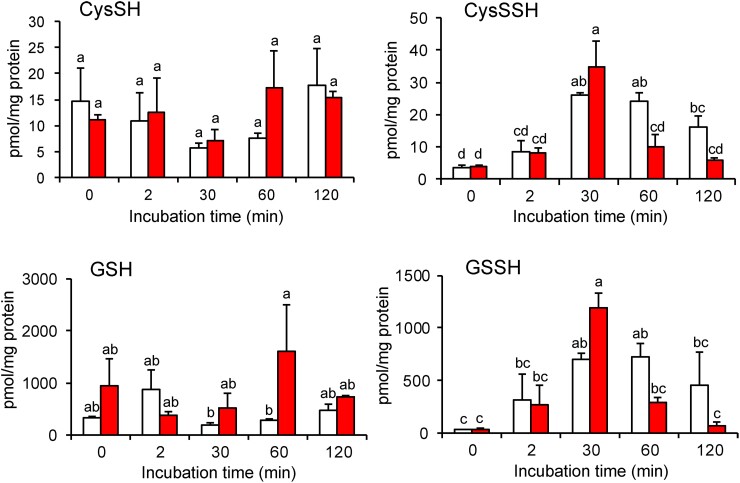
Fig. 2.
Polysulfide metabolomics in vivo in WT (white bars) and Δsqr (red bars). Cells were grown to the mid-log phase under aerobic conditions, and 0.2 mM sodium sulfide was added at t = 0. Cells were harvested at each time point and assayed for quantification of various sulfide species. Endogenous production of CysSSH and GSSH were identified by means of HPE-IAM labeling and LC-MS/MS analysis in the bacterial cells. Data are means ± SD (n = 3). Means followed by different letters are significantly different (Tukey test, P > 0.05).

