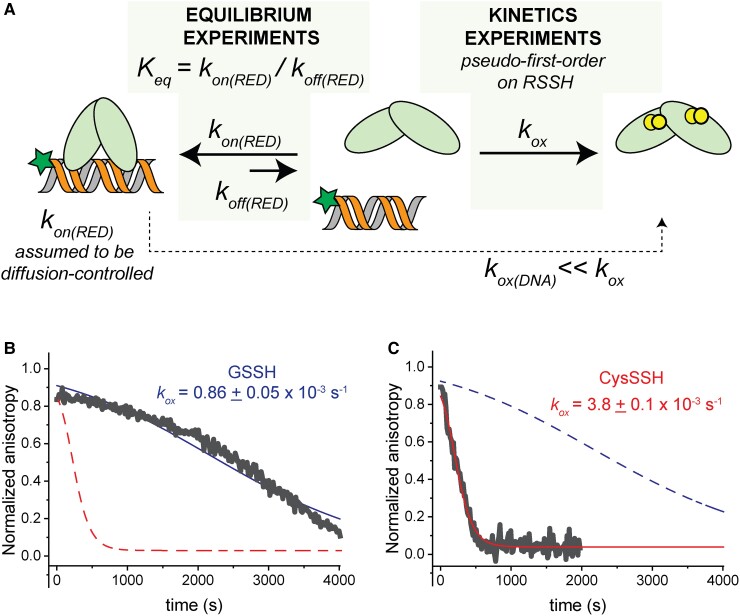
Fig. 3.
(A) Schematic representation of the fluorescence anisotropy approach used to study the kinetics of the DNA dissociation with RSSH and the experimental constraints. Kinetics of SqrR-DNA dissociation followed by anisotropy upon addition of in situ-prepared GSSH (B) or CysSSH (C). Data shown here (gray line) corresponds to the representative anisotropy changes after addition of the oxidant. The blue and the red lines correspond the fit of the data to simple pseudo-first order rate of oxidation (kox) with the parameters shown according to the model depicted in panel A. The dashed lines represent the fitting with the parameters corresponding to the oxidant not shown.

