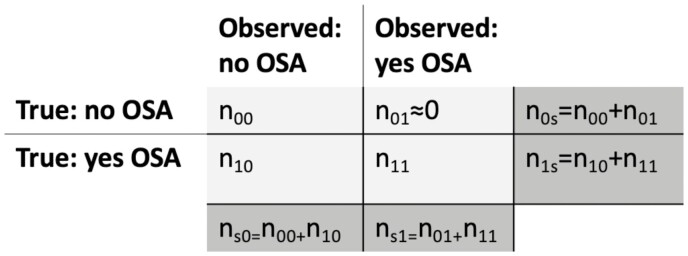
Figure 1.
True OSA status versus observed OSA status. Tabulation of the observed OSA status against the true, underlying OSA in a given study. The number of individuals in the study is decomposed into individuals in each of the table cells. The marginal, dark gray, cells sum the individuals in the rows and in the columns. In health records, typically we expect that the number of individuals who in truth do not have OSA yet are observed as having OSA is near zero.

