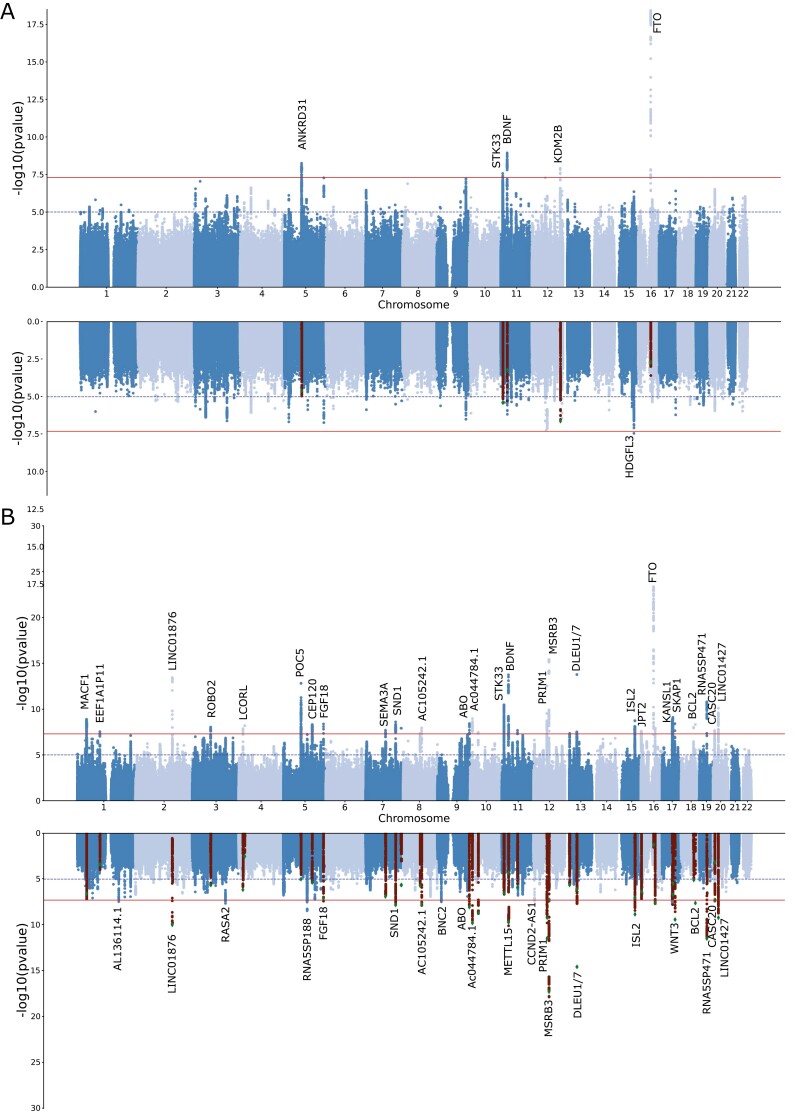
Figure 1.
Discovery of genetic associations with sleep apnea (SA) risk. Miami plots depict the meta-analysis results for SA before and after adjusting for BMI using mtCOJO (A) or MTAG for SA plus snoring before and after adjusting for BMI using mtCOJO (B). Each dot represents a genetic variant. The x-axis represents the variant’s genomic position, and the y-axis depicts the significance of the association with SA. In the BMI-adjusted analyses, highlighted variants show the genome-wide hits of the unadjusted GWAS.

