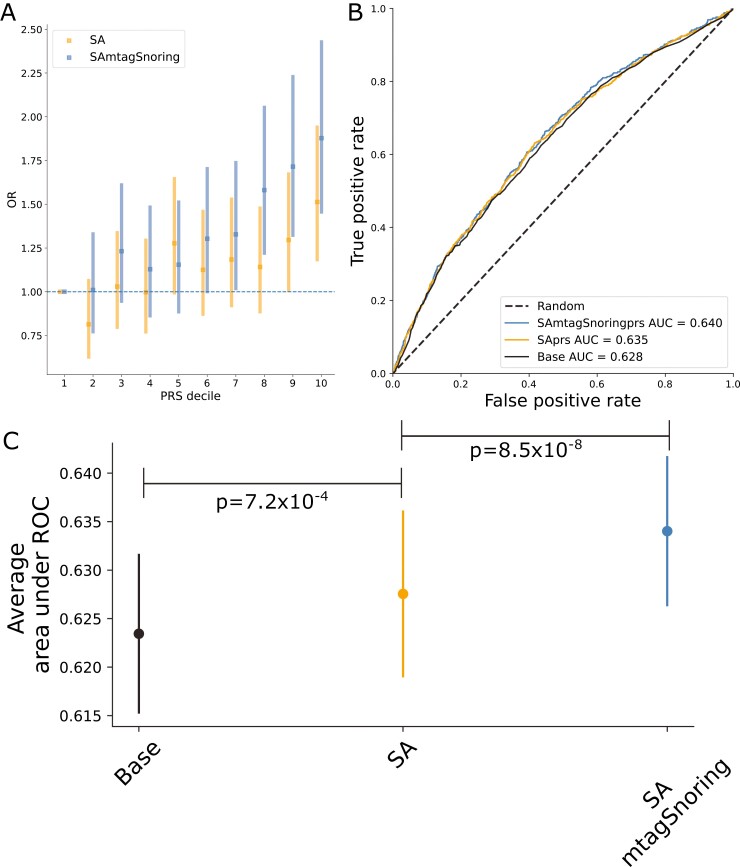
Figure 3.
Sleep apnea (SA) polygenic prediction. (A) Plot showing the odds ratio (OR) per change in polygenic risk score (PRS) decile. Error bars depict the 95% confidence intervals. (B) Example of a receiver operating characteristic (ROC) curve derived from assessing the ability of logistic regression to predict SA using either a base model (covariates only) or the base model plus the PRS of interest. The higher the area under the curve, the higher the model’s predictive power. (C) Average area under ROC curve after 100 iterations of leave out validation randomly assigning training and testing subsamples. Error bars depict the standard deviation of the mean. Full results (100 ROC curves per model) are available in Supplementary Figure 9. Abbreviations: SA, sleep apnea meta-analysis; SAmtagSnoring, sleep apnea plus snoring MTAG.

