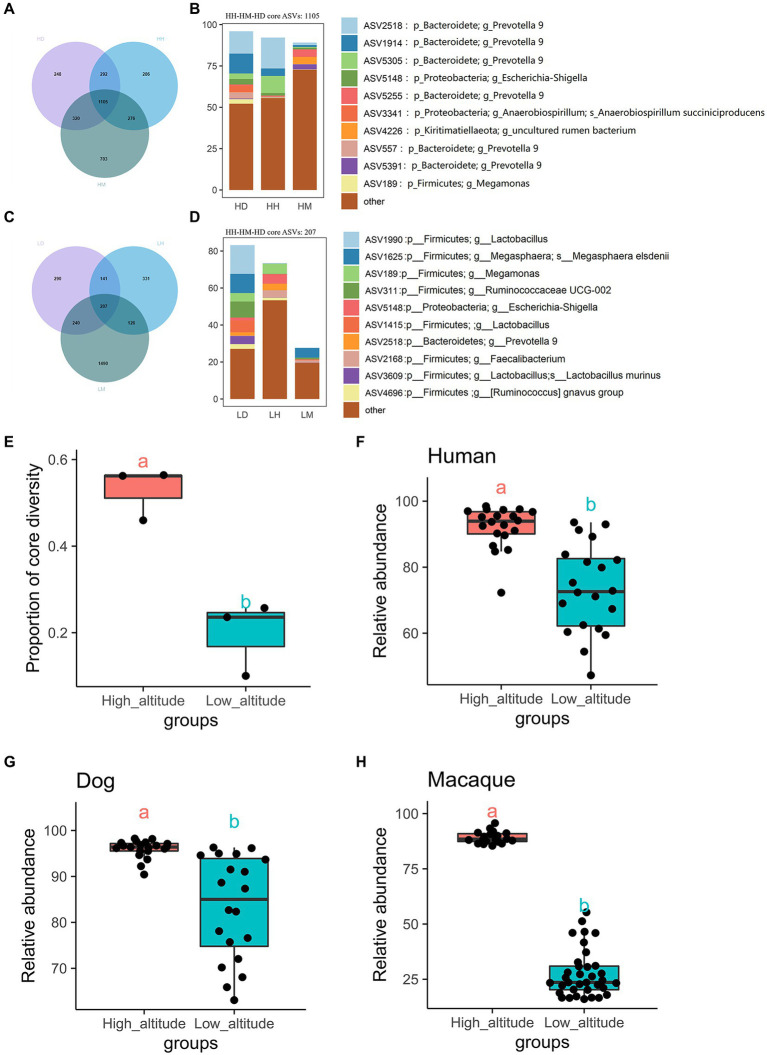
Figure 3.
Venn diagram and percentage histogram of core ASV between different groups. (A, C) Numbers in plots are marked for how many ASVs are in this part. (B, D) The histogram represents the relative abundance of core ASVs. (E) Differential analysis of the number of core shared microbial species as a percentage of the total number of species in the high and low altitude populations(T-test). (F–H) Differential analysis of relative abundances of core shared microbiota between the three species at high and low altitude (T-test). The same letter indicates the difference is not significant (p > 0.05), HH stands for high altitude humans, HD stands for high altitude dogs, HM stands for high altitude wild macaques, LH stands for low altitude humans, LD stands for low altitude dogs, LM stands for low altitude wild macaques.

