
Figure 3.
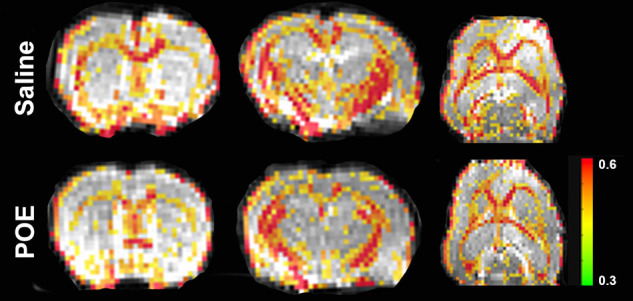
White matter microstructure alterations in POE: fractional anisotropy maps. These are sections of whole-brain fractional anisotropy maps in one representative Saline group scan (top row) and in one representative POE scan (bottom row). Two coronal sections (first two columns) and an axial section (last column) are included here. In each panel, the grayscale background is a raw b = 0 image; the superimposed colored voxels indicate fractional anisotropy (FA) for white matter voxels (voxels with FA > 0.3). The color of the white matter voxel indicates the FA value (from high [0.6+; red] to low [0.3; green]). Note that high-FA regions of large white matter tracts overall appear to be wider (spanning a greater diameter within each tract) and extend further along the length of each tract.