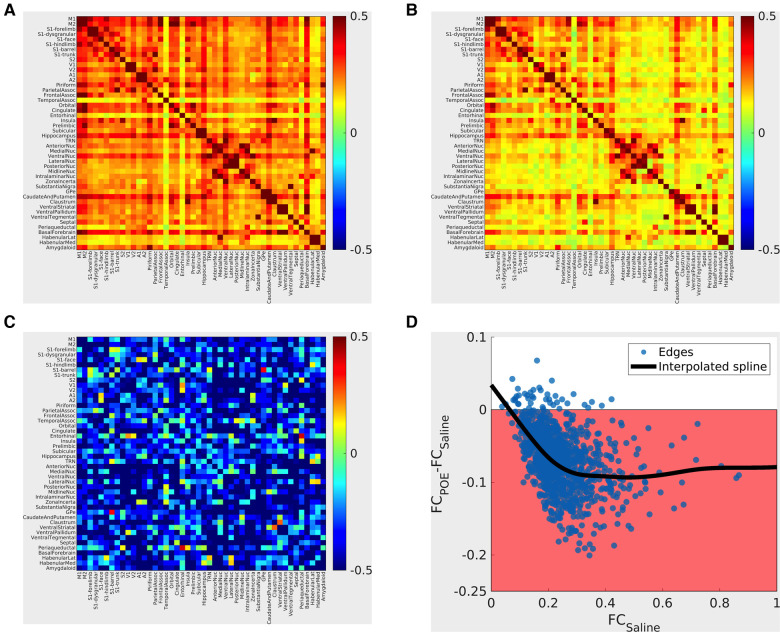
Figure 5.
Functional connectivity alterations in POE. Top panels: Group mean cross-correlation (functional connectivity) matrices. Heatmaps (A: saline group; B: methadone group) summarize functional connectivity profiles seen in each group—each row and each column correspond to a gray matter ROI, and the color of the voxel at the intersection of the row/column indicates the functional connectivity seen between the two ROIs (warm colors = positive correlation; cool colors = negative correlation). “Strong” (high FC) connections seen nearly all consisted of positive correlations and that “strong” connections were seen in both groups, for example, within sensorimotor cortical networks and between thalamic nuclei. Bottom left panel C: Between-group differences are pictured in terms of standardized effect size (Glass's Δ; differences in group means in units of Saline standard deviation). Highly positive values (warm colors) indicate FCPOE > FCSaline, and highly negative values (cool colors) indicate FCPOE < FCSaline. Absolute values greater than 0.8 are considered “large” effect sizes. Note that edges with large effect sizes are predominantly negative (FCPOE < FCSaline) with clusters including cortico-cortical and cortico-basal ganglia edges. Bottom right panel D: Between-group differences vs. FCSaline. Each point indicates one ROI-to-ROI connection; x-values indicate FCSaline, and y-values indicate FCPOE-FCSaline. The shaded region indicates FCPOE < FCSaline. The bold line indicates a smoothed curve to visualize overall trends (MATLAB smoothingspline, SmoothingParam = 0.995). Note again that nearly all edges exhibit FCPOE < FCSaline and that differences are particularly prominent for “strong” (high FCSaline) connections.

