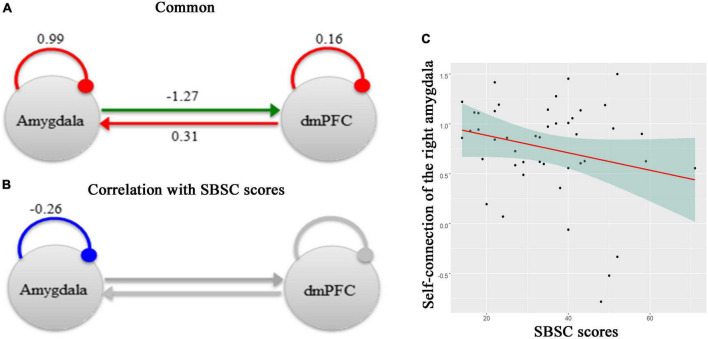
FIGURE 3.
A schematic summarizing effective connectivity between the right amygdala and the dmPFC across participants in the Hubei Cohort and its correlation with stress responses at the first survey. (A) The green arrow represents the positive extrinsic effective connectivity and the red arrow represents the negative extrinsic effective connectivity. The parameters are the strength of connectivity. The red arcs represent self-connections. For the self-connections, the parameters are log scaling parameters, which can be converted to units of Hz by: y =–0.5 * exp(x). Where x is the log scaling parameter, −0.5 Hz is the prior and y is the self-connection strength in units of Hz. (B) The parameter is the effect of the stress responses on the self-connection. All of the other connections in this network, which had no correlations with the SBSC scores, were shown in gray. (C) A scatter plot showing the relationship between the self-connection in the right amygdala and the stress responses.

