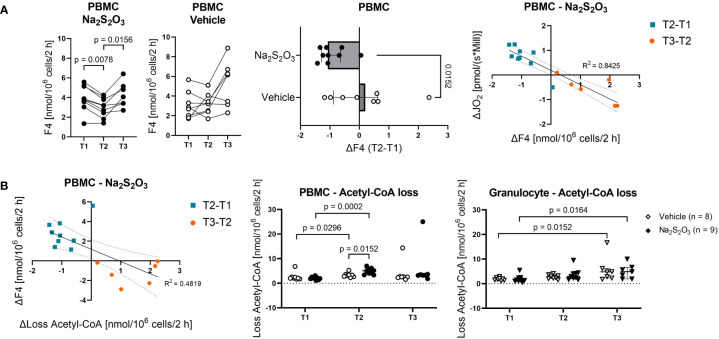
Figure 5.
The effect of Na2S2O3 on porcine PBMCs. Metabolic fluxes calculated from 13C labeling patterns on metabolites. PBMCs are displayed as circles and granulocytes as triangles. Animals were treated either with vehicle (n = 8, bright symbols) or Na2S2O3 (n = 9, dark symbols). (A) F4 trends in PBMCs in vehicle vs Na2S2O3-treated animals and correlations between the difference in F4 and the difference in routine respiration over time. (B) Acetyl-CoA loss of PBMCs and granulocytes. Correlation between the difference in F4 and the difference in Acetyl-CoA loss over time. Significant P values are indicated in the graphs; Mann-Whitney U test for intergroup differences, Kruskal-Wallis rank sum test for time-related effects. Data are presented as median with IQR. Correlations are presented with 95% confidence intervals.

