Figure 2.
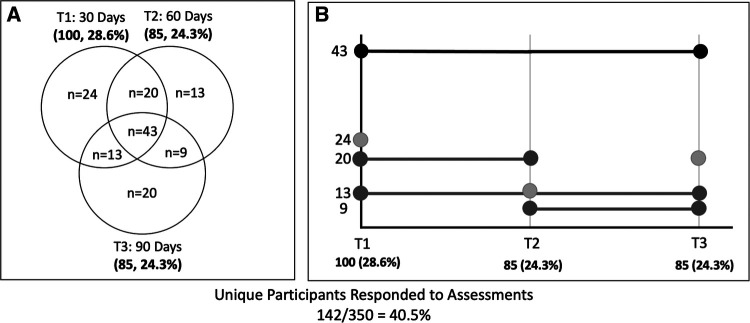
(A) Number of SMS-text assessment responses at different time points depicted in a Venn diagram (N, N%). N indicates unique participant responses. For example, N = 13 participants responded at 60 days poststroke, N = 20 answered at both 30 and 60 days, and N = 43 responded at all three study time points. (B) SMS-text assessment compliance over time. Shades of gray (dark to light) correspond to those that responded at all time points, those that responded at two timepoints (T1 and T2, T1 and T3, or T2 and T3), and those that responded at a single time point (T1, T2, or T3). SMS, short message service.

