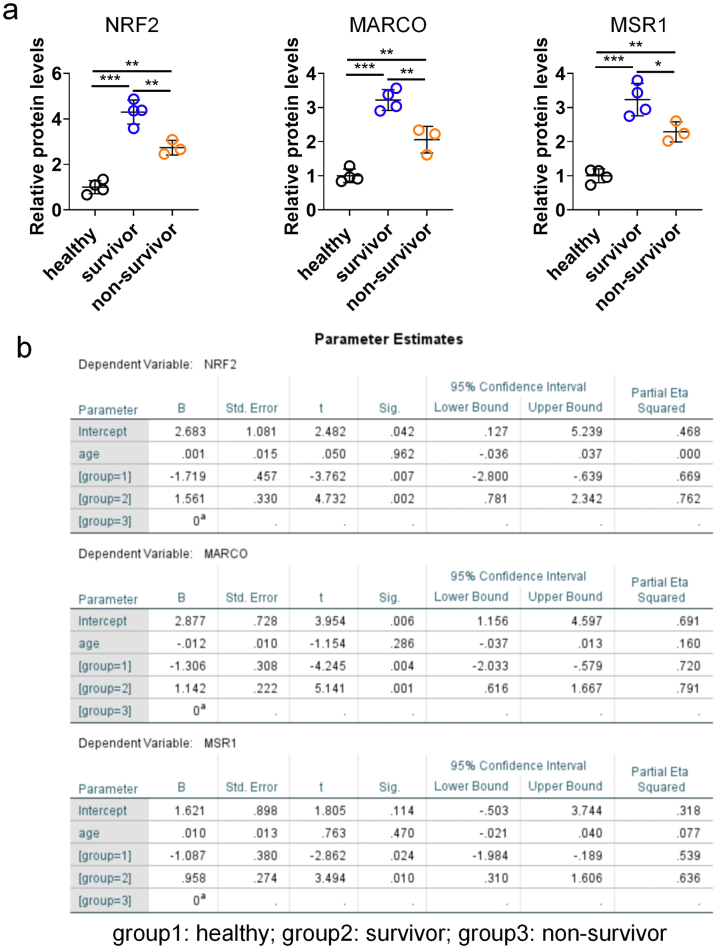
Figure S9.
The statistical analysis of relative protein levels in monocytes from human samples. (a) The relative protein levels of NRF2, MARCO, and MSR1 in Fig. 8c were analyzed using one-way ANOVA with Bonferroni post-hoc test (healthy vs survivor: p < 0.0001 (NRF2), p < 0.0001 (MARCO), p < 0.0001 (MSR1); healthy vs non-survivor: p = 0.0015 (NRF2), p = 0.0047 (MARCO), p = 0.0039 (MSR1); survivor vs non-survivor: p = 0.0029 (NRF2), p = 0.0027 (MARCO), p = 0.0228 (MSR1)). Results are presented as the mean ± SD (∗p < 0.05, ∗∗p < 0.01, and ∗∗∗p < 0.001). (b) The data in a were further analyzed using linear regression adjusting for variable “age”. The detail parameters are shown.

