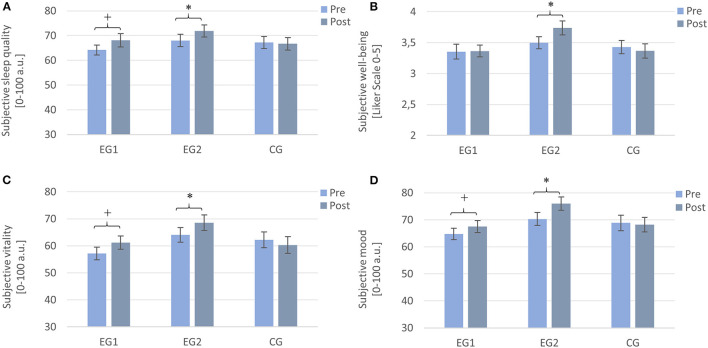
Figure 2.
Subjective values assessed by sleep diaries from pre- to post-intervention. Note that EG1 improved tendentially in (A) sleep quality, (C) vitality, and (D) mood, but not in (B) well-being, and the EG2 improved significantly on all parameters, while the CG did not show any improvements. Measurements were assessed daily and averaged over a week each. EG1 (n = 34), EG2 (n = 32), and CG2 (n = 32). Asterisks represent significant results, *p < 0.05, +p < 0.10, two-tailed. Error bars display ±1 standard error. EG1, experimental group one; EG2, experimental group two; CG, control group.

