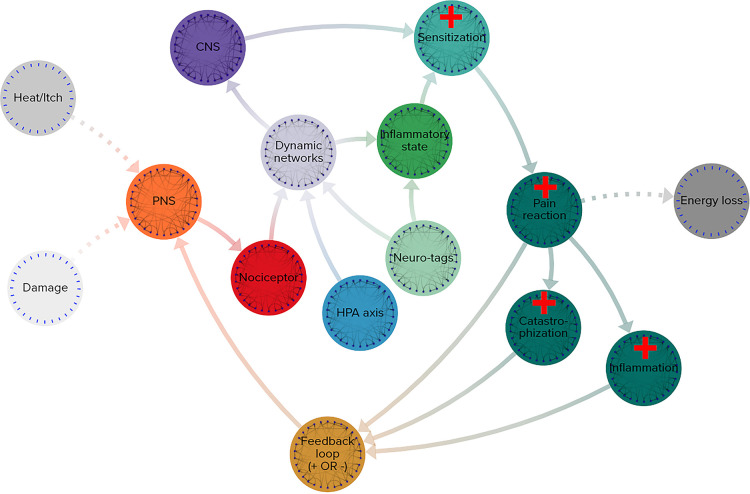
Figure 5.
Simplified functional map of pain response system. Grey-scale nodes: outside the system, orange: input stimuli, red: functional detection, blue: multi-scale networks, light green: unpredictable effects, violet: dynamic networks, purple: active agents of change, dark teal: effects of system change, brown: output leading to input in a feedback loop.

