FIGURE 4.
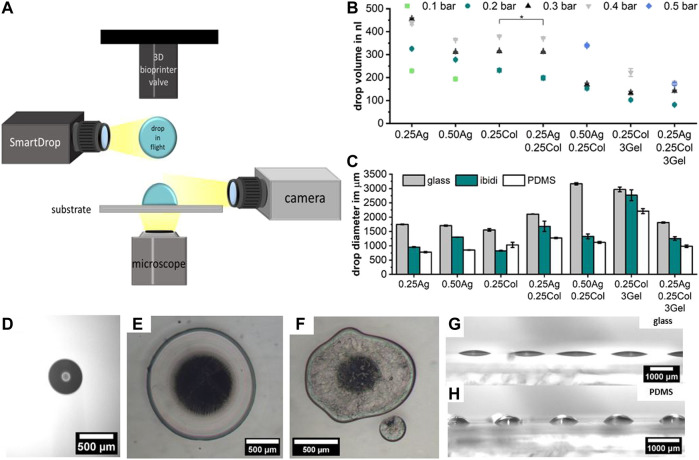
Schematic representation of the optical characterization of hydrogel blend printability, including the drop volume in flight using an embedded “SmartDrop” system, the effective drop diameter after printing on various substrates using an optical microscope, and the wetting behavior observed by camera (A). The drop volume for different print pressures measured using the “SmartDrop” system; with p < 0.001 unless stated otherwise, number of samples for each data point is in Supplementary Figure S2 (B). The drop diameter on three different substrates measured using an optical microscope is given for the minimum printable pressure in bar noted on top of the bars (C). Example image of the drop volume detection in flight (D). Microscopy of drops of 0.25Ag (E) and of 0.25Ag0.25Col3Gel (F) printed on PDMS at 0.2 bar clearly show the difference in roundness and the occurrence of satellite drops for AgCol-blends. The difference in effective drop area for different substrates is caused by the wetting behavior, as shown for 0.50Ag on glass (G) and PDMS (H) printed with 0.2 bar print pressure; n = 10.

