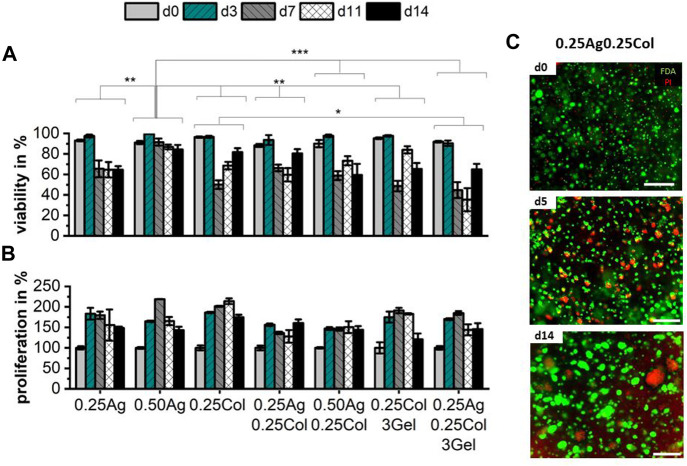
FIGURE 5.
Cell viability (A) and proliferation (B) of 1 × 10⁶ cells/ml of HepG2 cells in agarose, collagen and gelatin blends over the course of 14 days; n = 3 with ns for no significance, * for p < 0.05, ** for p < 0.01 and *** for p < 0.001. Exemplary images of HepG2 in 0.25Ag0.25Col stained with FDA for live (green) and PI for dead (red) cells on days 0, 5 and 14 show increasing size and number of agglomerates with necrotic cores (C). Scale bar showing 500 µm.

