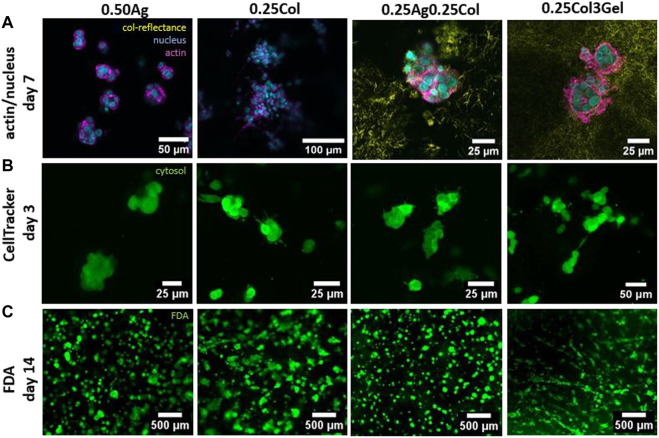
FIGURE 6.
Confocal fluorescence microscopy images of HepG2 cells in 0.50Ag, 0.25Col, 0.25Ag0.25Col, 0.25Col3Gel with actin filaments (magenta) and cell nuclei (blue) stained on day 7 and collagen fibers visualized by confocal reflectance (yellow) (A). Images of HepG2 cells marked green with CellTracker on day 3 (B) and live cells stained green with FDA on day 14 (C).

