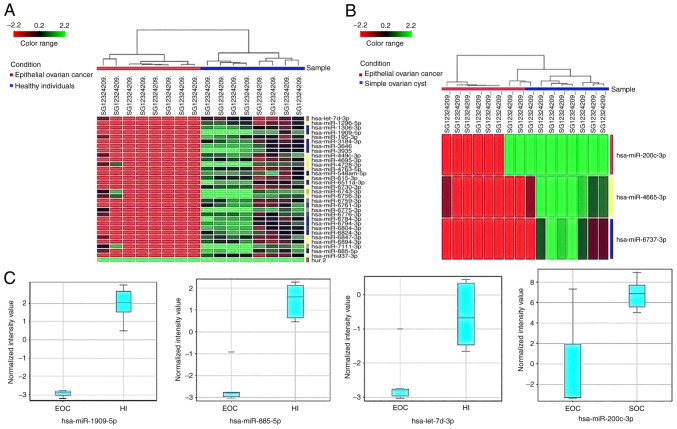
Figure 2.
Hierarchical clustering and box-whisker plots of differentially expressed miRNAs in both serum and tissue samples. (A) Hierarchical clustering of differentially expressed miRs in serum EOC and HI samples. EOC serum samples are distributed under the red line and the HI samples under the blue line. Red rectangles indicate expression lower than the mean intensity and the green rectangles indicate expression higher than the mean intensity. (B) EOC and SOC tissue samples with P<0.05 determined by microarray analysis. EOC serum samples are distributed under the blue line and the SOC samples under the red line. Vertical codes represent different samples. (C) Box-whisker plots of serum miRs (hsa-miR-1909-5p, hsa-miR-885-5p and hsa-let-7d-3p) in both EOC and HI and the tissue miR (hsa-miR-200c-3p) in both SOC and EOC. EOC, epithelial ovarian cancer; HI, healthy individual; miR, microRNA; SOC, simple ovarian cyst.

