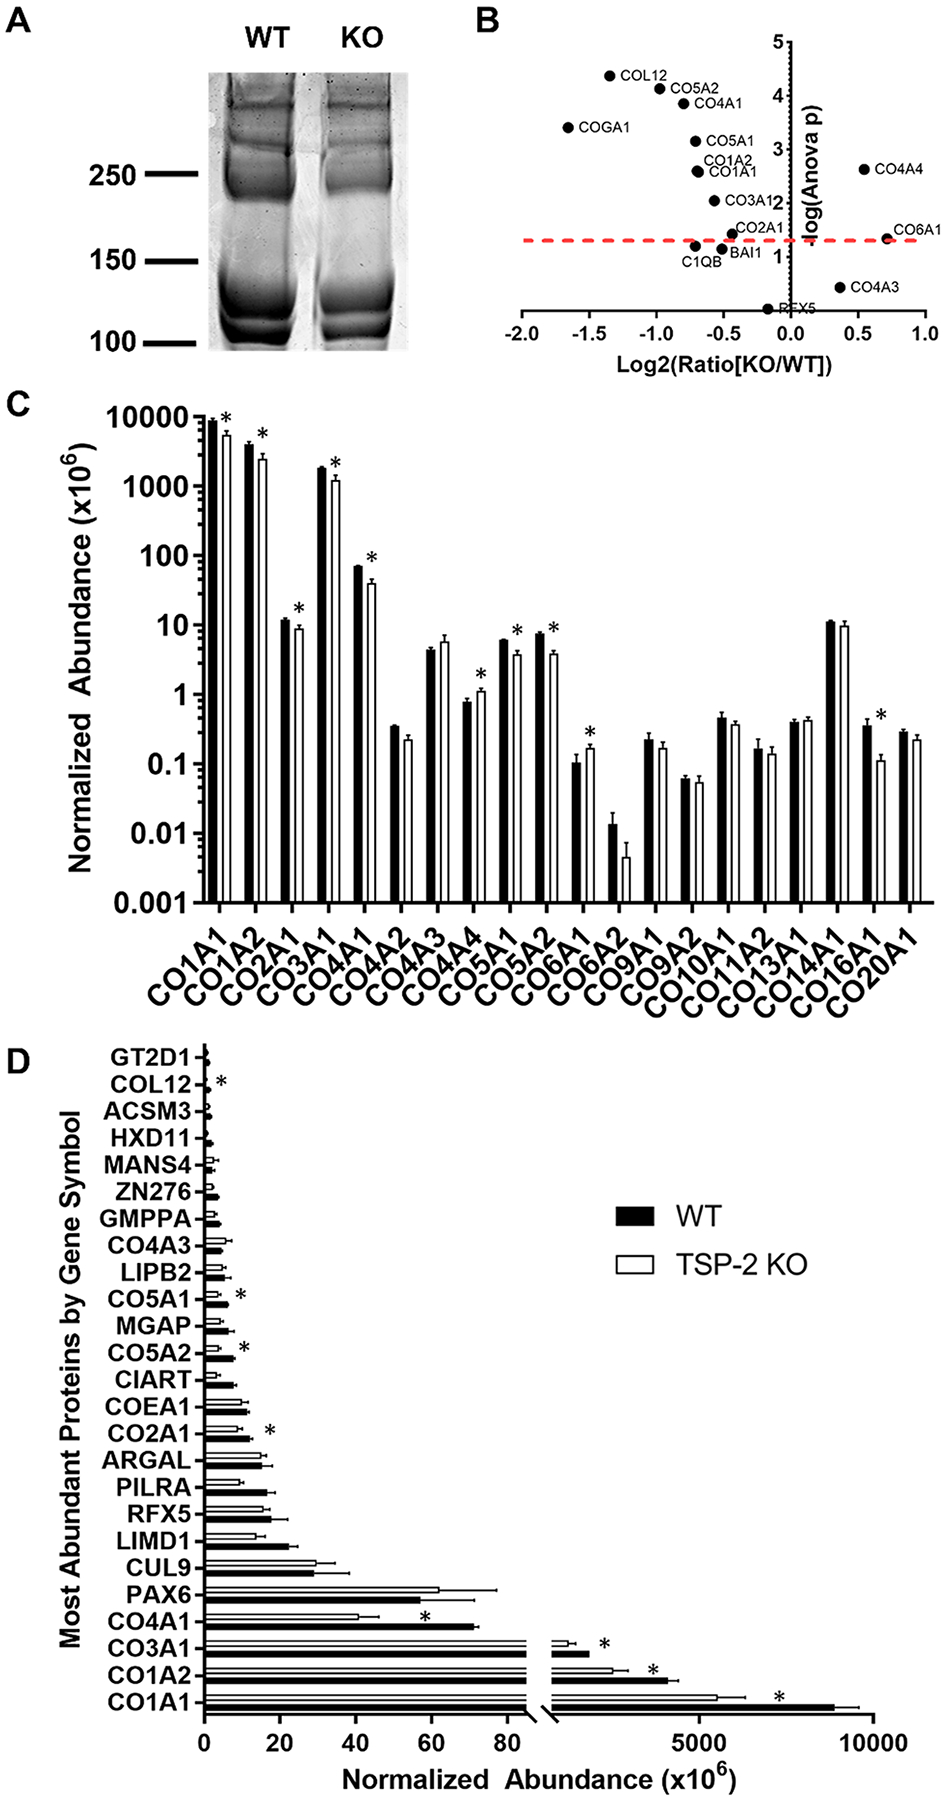
Figure 2.

Proteomics reveals subtle changes in composition of hydrogels between genotypes. (A) SDS–PAGE demonstrates qualitative differences in the protein content of WT and TSP-2 KO gels. (B) A volcano plot of quantitative proteomics results demonstrates significant differences between WT and TSP-2 KO (above the red dashed line is p < 0.05). (C) Collagen abundance from quantitative proteomics exhibits similar, albeit altered, levels between genotypes. (D) The top 25 most abundant proteins show differences between WT and TSP-2 KO gels. Results are given as mean + SEM, n = 3, *p < 0.05.
