Figure 2.
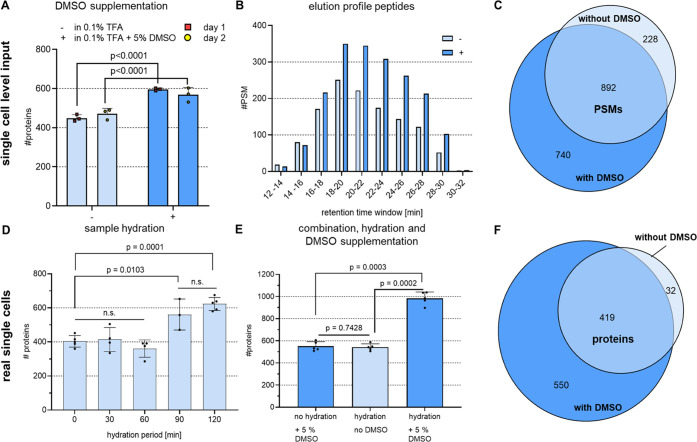
DMSO supplementation and sample hydration improved the recovery of hydrophobic peptides and boosted IDs. All data were acquired using DDA and then analyzed using the CHIMERYS algorithm with 1% FDR at the PSM and protein levels. (A) 250 pg HeLa bulk digest dissolved at a concentration of 71 ng/μL in the presence or absence of 5% DMSO prior to injection into the LC-MS. The bars and error bars show the resulting protein IDs and their standard deviations. To estimate significance, an unpaired two-tailed Student’s t-test was performed. The resulting p values are shown above each compared data set, n = 6 technical replicates measured on 2 different days. (B) Data from a representative replicate of the DMSO tests performed in panel (A). The bars present the PSM matches in each retention time window. (C) Venn diagram showing the common PSMs from the protein IDs shown in panel (B). (D) Individual HeLa cells were lysed and digested at 50 °C for 2 h, while the sample was hydrated with automated water supplementation for the time periods shown. The bars and error bars show the resulting protein IDs and their standard deviations. A one-way ANOVA with Tukey’s multiple comparison post-test was performed, n ≥ 3 replicates. (E) Individual HeLa cells were kept hydrated for 2 h or dried upon evaporation during digestion in the presence or absence of DMSO in the final storage solution. The bars and error bars show the resulting protein IDs with their standard deviations. An unpaired two-tailed Student’s t-test was performed, and the resulting p values are shown above each compared data set, n = 5 replicates. (F) Venn diagram showing the common protein IDs from a representative replicate comparing hydration and no DMSO with hydration plus 5% DMSO from the data shown in panel (E).

