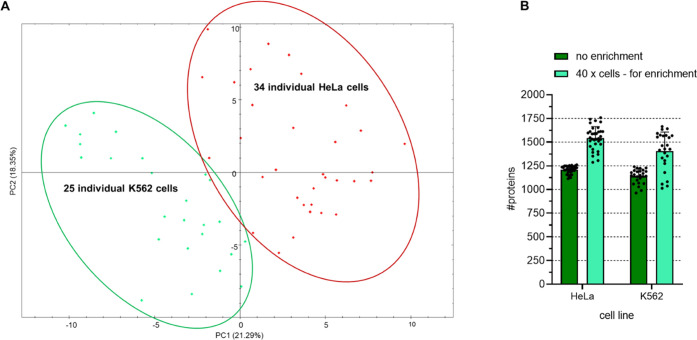
Figure 8.
Application of optimal sample preparation, data acquisition, and data analysis parameters to single-cell analysis of two human cell lines. Individual HeLa or K562 cells were processed using the improved workflow, and the resulting peptides were separated using a 5.5 cm μPAC HPLC column in a 20 min active gradient. Data acquisition was by DIA with variable window sizes. Spectronaut was used for data analysis with 1% FDR at the protein level and MBR. (A) Principal component analysis in Spectronaut. Each dot represents one cell, with HeLa cells shown in red and K562 cells shown in green. (B) Bar chart comparison of the average number of identified proteins when analyzing data in the direct DIA mode without data enrichment, with data enrichment from 4 replicates, each originating from 40 HeLa or 40 K562 cells.

