
FIGURE 2.
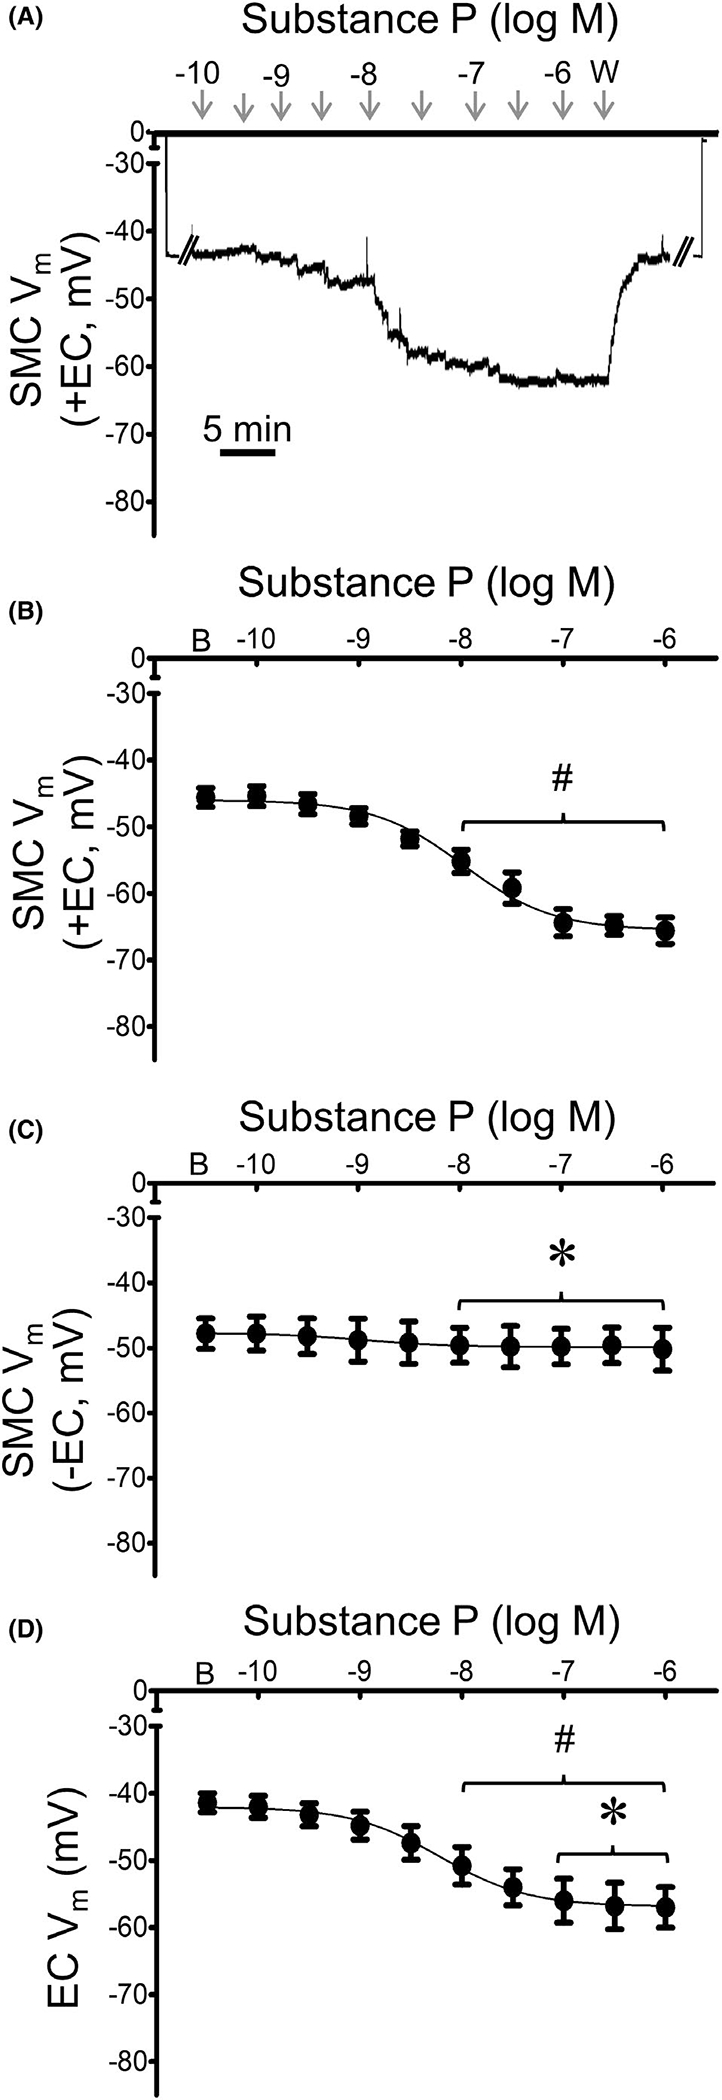
Mesenteric artery SMCs and ECs are hyperpolarized by SP. (A) Representative recording of membrane potential (Vm) illustrates concentration-dependent hyperpolarization of a SMC by SP in an intact MA (+EC). From zero baseline, note abrupt change in Vm upon entry and exit from cell. (B) Summary data for Vm of SMCs in intact MAs (+EC) studied at 37°C to increasing [SP] (10−10–10−6 M). (C) Summary data for Vm of SMCs of endothelium-disrupted MAs (−EC) studied at 37°C to SP as in B. (D) Summary data for Vm of ECs within endothelial tubes studied at 32°C to SP as in B. Values are means ± SEM for n = 5 per group. B = baseline Vm. W = washout in control PSS. #p < 0.05 vs. baseline (prior to application of SP) Vm. *p < 0.05 vs. SMC (+EC)