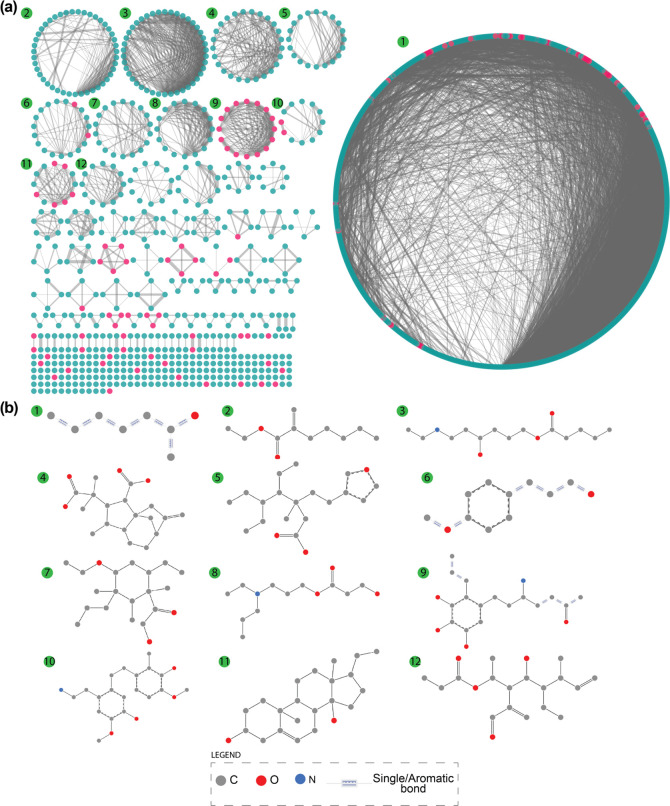
Figure 10.
(a) Chemical similarity network (CSN) of the 1335 drug-like phytochemicals in IMPPAT 2.0. The degree sorted circle layout in Cytoscape76 is used to visualize the CSN. Cyan nodes correspond to drug-like phytochemicals that are not similar to any approved drug, and pink nodes correspond to those that are similar to at least one approved drug. Edge thickness is proportional to the chemical similarity between the pair of drug-like phytochemicals. (b) Visualization of the SMARTS corresponding to the maximum common substructure (MCS) for the top 12 connected components obtained using the SMARTSview webserver.77,78

