Figure 11.
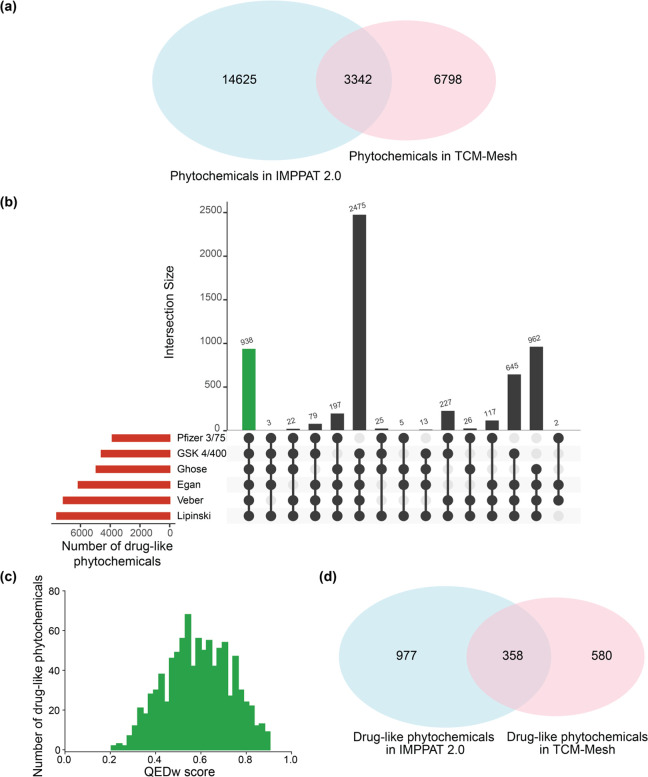
Comparison of the phytochemical space of Indian medicinal plants and Chinese medicinal plants. (a) Venn diagram shows the overlap between the phytochemicals in IMPPAT 2.0 and TCM-Mesh. (b) UpSet plot visualization of the set intersections of phytochemicals in TCM-Mesh that pass one or more of the six drug-likeness rules. The horizontal bars show the number of phytochemicals that pass the different drug-likeness rules. The vertical bars show the set intersections between phytochemicals that pass different drug-likeness rules. The green bar shows the 938 phytochemicals that pass all six drug-likeness rules. (c) Distribution of QEDw scores for the 938 drug-like phytochemicals in TCM-Mesh. (d) Venn diagram shows the overlap between the drug-like phytochemicals in IMPPAT 2.0 and TCM-Mesh.

