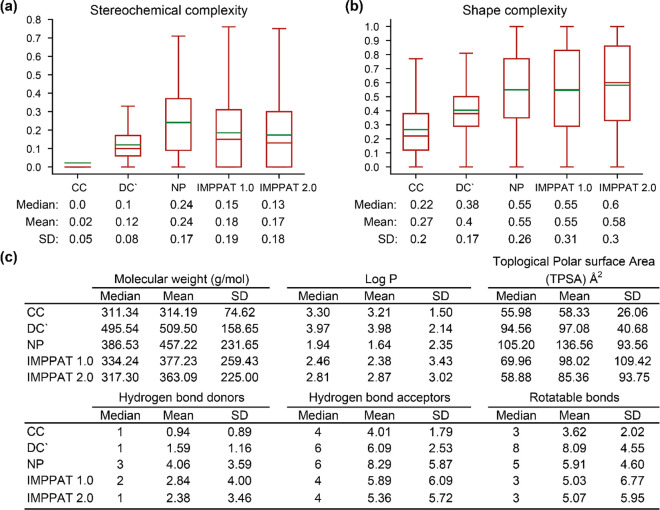
Figure 6.
Comparison of the molecular complexity of chemical libraries. (a) Distribution of the stereochemical complexity and (b) the shape complexity for small molecules in five chemical libraries, namely, CC, DC’, NP, IMPPAT 1.0, and IMPPAT 2.0. Note that the lower end of the box plot is the first quartile, the upper end is the third quartile, the brown line inside the box is the median, and the green line is the mean of the distribution. Also, the median, mean, and standard deviation (SD) of the distribution are shown below the box plot. (c) Median, mean, and SD for six physicochemical properties, namely, molecular weight (g/mol), log P, topological polar surface area (TPSA) (Å2), number of hydrogen bond donors, number of hydrogen bond acceptors, and number of rotatable bonds, for small molecules in five chemical libraries.

