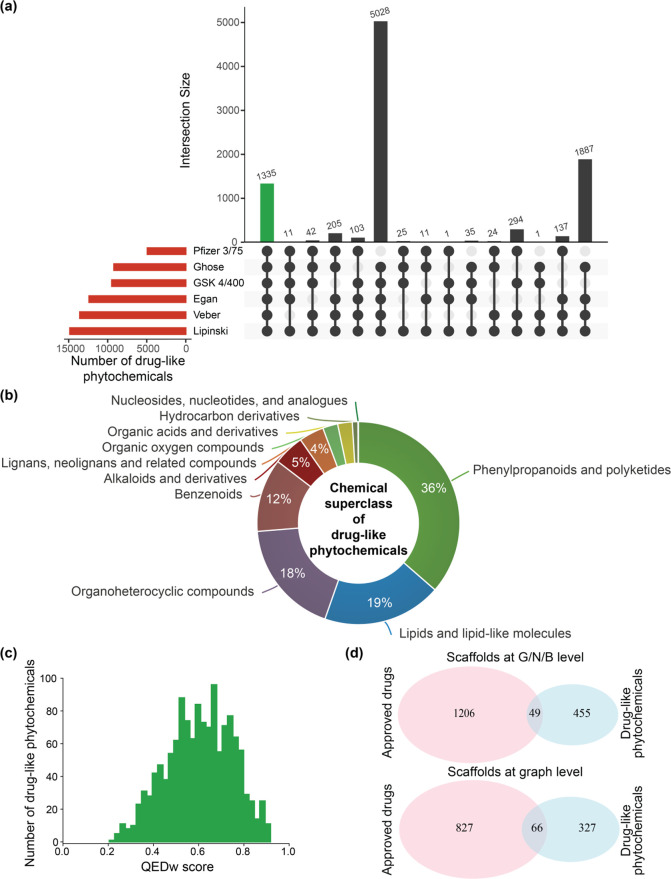
Figure 9.
Drug-likeness analysis of phytochemicals in IMPPAT 2.0. (a) UpSet plot visualization of the set intersections of phytochemicals that pass one or more of the six drug-likeness rules. The horizontal bars show the number of phytochemicals that pass the different drug-likeness rules. The vertical bars show the set intersections between phytochemicals that pass different drug-likeness rules. The green bar shows the 1335 phytochemicals that pass all six drug-likeness rules. This plot was generated using the UpSetR package.74 (b) Chemical superclass of the 1335 drug-like phytochemicals as predicted by ClassyFire. (c) Distribution of QEDw scores for the 1335 drug-like phytochemicals. (d) Common scaffolds at the graph/node/bond (G/N/B) level and the graph level between the space of 1335 drug-like phytochemicals and approved drugs.

