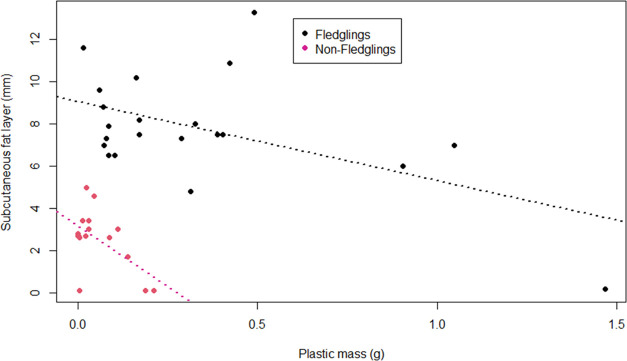
Figure 2.
Visualization of the relation between mass of ingested plastic (g; x-axis) and depth of the subcutaneous fat layer (mm; y-axis). Each dot indicates an individual and the age category is indicated by colors. Linear regressions (dotted lines) are included for fledglings (black) and nonfledglings (violet-red).

