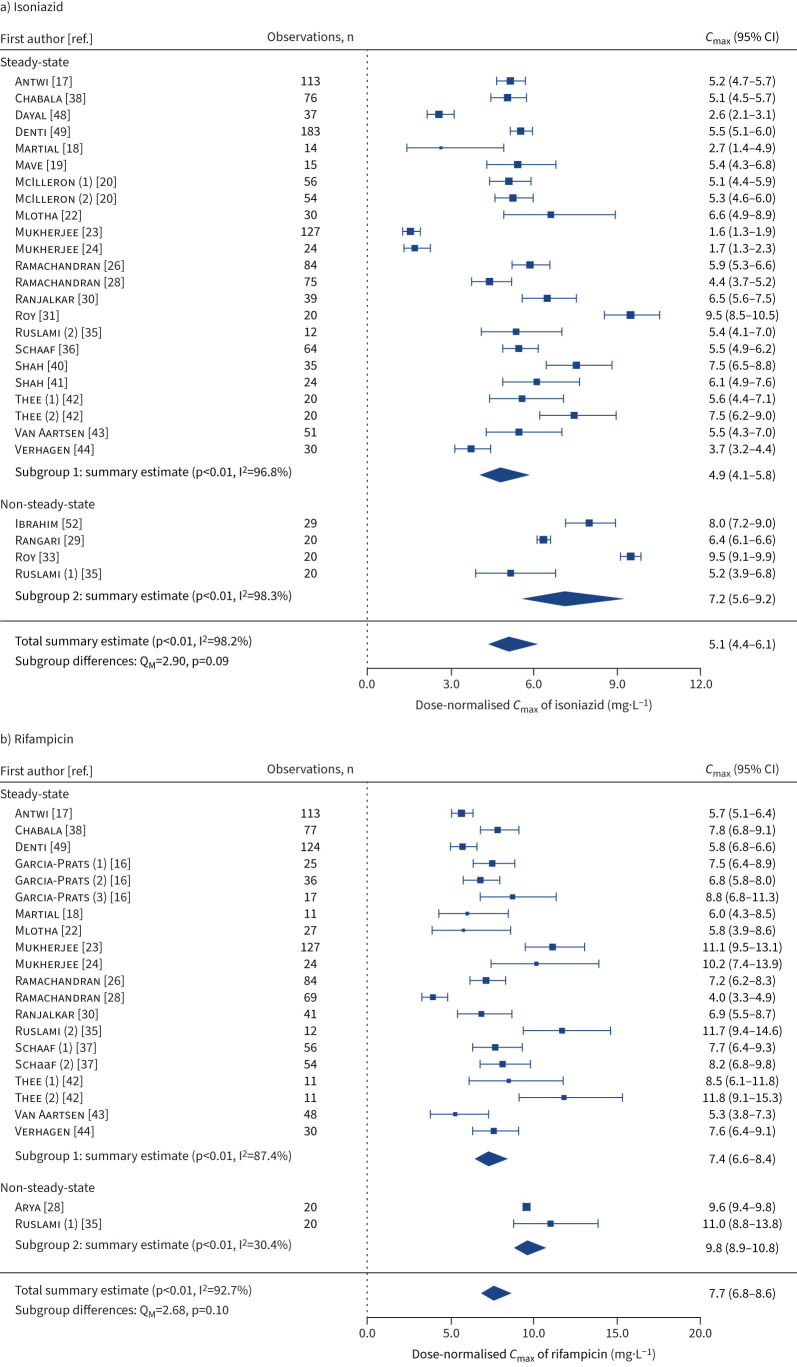
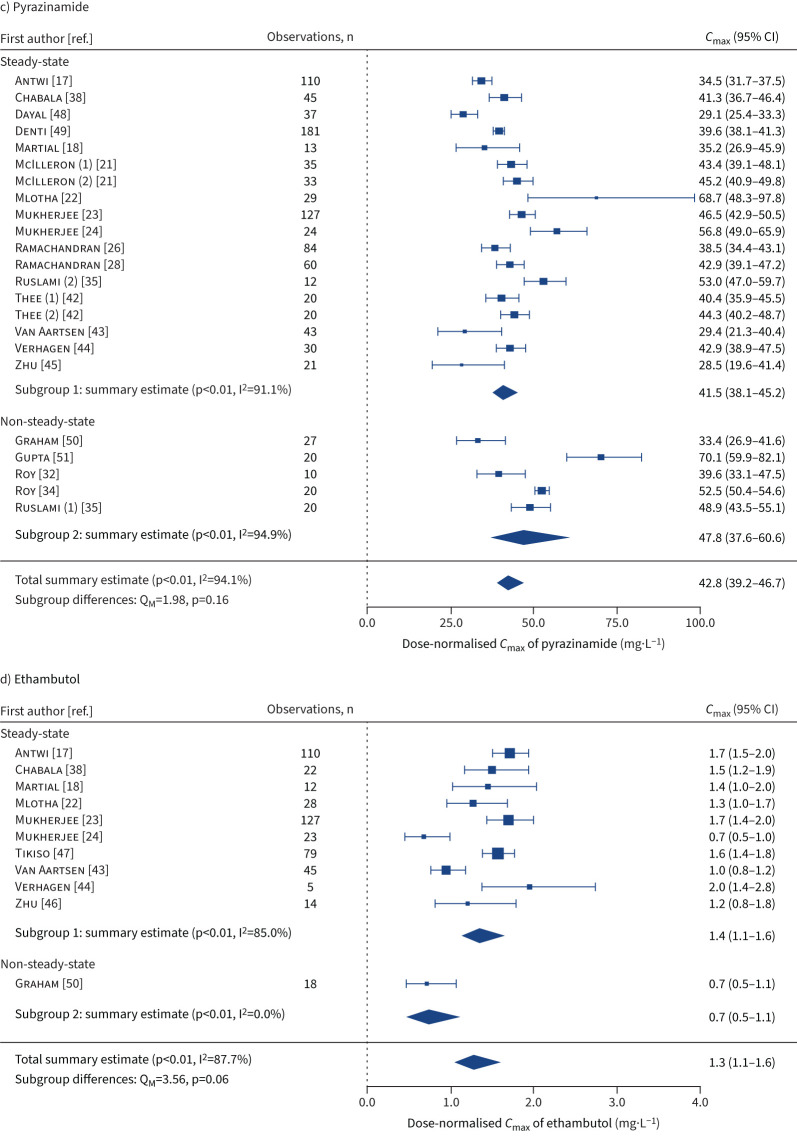
FIGURE 3.
Forest plots for summary estimates (geometric mean (95% CI)) of dose-normalised peak plasma concentration (Cmax) for a) isoniazid, b) rifampicin, c) pyrazinamide and d) ethambutol in children and adolescents with tuberculosis, by sampling schedules (steady-state and non-steady-state). Cmax values were dose-normalised for isoniazid at 10 mg·kg−1, rifampicin at 15 mg·kg−1, pyrazinamide at 35 mg·kg−1 and ethambutol at 20 mg·kg−1. The number in round brackets after the author's name indicates the different sampling occasions within a study. I2: percentage of variation across studies that is due to heterogeneity; QM: omnibus test of all model coefficients.


